Providing a diverse range of perspectives from bullish to bearish, 5 analysts have published ratings on Canaan (NASDAQ:CAN) in the last three months.
The table below summarizes their recent ratings, showcasing the evolving sentiments within the past 30 days and comparing them to the preceding months.
| Bullish | Somewhat Bullish | Indifferent | Somewhat Bearish | Bearish | |
|---|---|---|---|---|---|
| Total Ratings | 5 | 0 | 0 | 0 | 0 |
| Last 30D | 1 | 0 | 0 | 0 | 0 |
| 1M Ago | 1 | 0 | 0 | 0 | 0 |
| 2M Ago | 3 | 0 | 0 | 0 | 0 |
| 3M Ago | 0 | 0 | 0 | 0 | 0 |
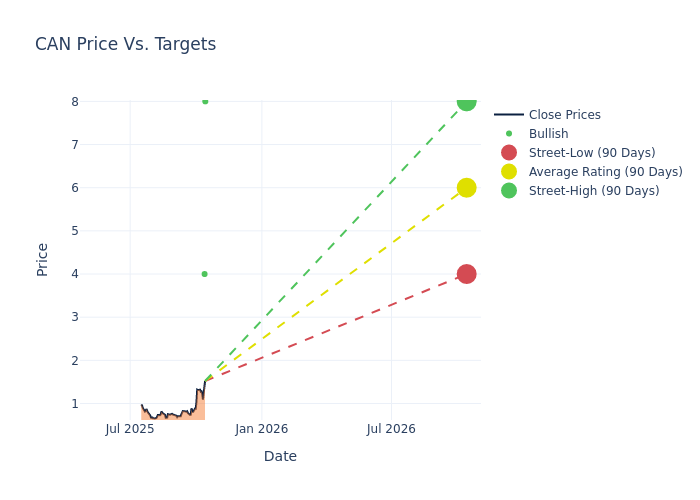
In the assessment of 12-month price targets, analysts unveil insights for Canaan, presenting an average target of $4.8, a high estimate of $8.00, and a low estimate of $4.00. This current average represents a 4.0% decrease from the previous average price target of $5.00.
Exploring Analyst Ratings: An In-Depth Overview
The analysis of recent analyst actions sheds light on the perception of Canaan by financial experts. The following summary presents key analysts, their recent evaluations, and adjustments to ratings and price targets.
| Analyst | Analyst Firm | Action Taken | Rating | Current Price Target | Prior Price Target |
|---|---|---|---|---|---|
| Justin Zelin | BTIG | Maintains | Buy | $8.00 | $8.00 |
| Kevin Cassidy | Rosenblatt | Maintains | Buy | $4.00 | $4.00 |
| Kevin Cassidy | Rosenblatt | Maintains | Buy | $4.00 | $4.00 |
| Kevin Cassidy | Rosenblatt | Maintains | Buy | $4.00 | $4.00 |
| Kevin Cassidy | Rosenblatt | Lowers | Buy | $4.00 | $5.00 |
Key Insights:
- Action Taken: Analysts frequently update their recommendations based on evolving market conditions and company performance. Whether they 'Maintain', 'Raise' or 'Lower' their stance, it reflects their reaction to recent developments related to Canaan. This information provides a snapshot of how analysts perceive the current state of the company.
- Rating: Delving into assessments, analysts assign qualitative values, from 'Outperform' to 'Underperform'. These ratings communicate expectations for the relative performance of Canaan compared to the broader market.
- Price Targets: Understanding forecasts, analysts offer estimates for Canaan's future value. Examining the current and prior targets provides insight into analysts' changing expectations.
Analyzing these analyst evaluations alongside relevant financial metrics can provide a comprehensive view of Canaan's market position. Stay informed and make data-driven decisions with the assistance of our Ratings Table.
Stay up to date on Canaan analyst ratings.
If you are interested in following small-cap stock news and performance you can start by tracking it here.
Get to Know Canaan Better
Canaan Inc is a developer of supercomputing chips and the manufacturer of digital blockchain computing equipment and the supplier of the overall scheme for computer software and hardware of digital blockchain. The revenues of the company are derived from the sales of Bitcoin mining machines and related parts and accessories. Geographically, the company derives its maximum revenue from United States.
Understanding the Numbers: Canaan's Finances
Market Capitalization Analysis: Positioned below industry benchmarks, the company's market capitalization faces constraints in size. This could be influenced by factors such as growth expectations or operational capacity.
Positive Revenue Trend: Examining Canaan's financials over 3M reveals a positive narrative. The company achieved a noteworthy revenue growth rate of 39.45% as of 30 June, 2025, showcasing a substantial increase in top-line earnings. As compared to competitors, the company surpassed expectations with a growth rate higher than the average among peers in the Information Technology sector.
Net Margin: The company's net margin is a standout performer, exceeding industry averages. With an impressive net margin of -11.03%, the company showcases strong profitability and effective cost control.
Return on Equity (ROE): Canaan's ROE is below industry standards, pointing towards difficulties in efficiently utilizing equity capital. With an ROE of -3.89%, the company may encounter challenges in delivering satisfactory returns for shareholders.
Return on Assets (ROA): Canaan's ROA lags behind industry averages, suggesting challenges in maximizing returns from its assets. With an ROA of -1.91%, the company may face hurdles in achieving optimal financial performance.
Debt Management: Canaan's debt-to-equity ratio is below the industry average. With a ratio of 0.15, the company relies less on debt financing, maintaining a healthier balance between debt and equity, which can be viewed positively by investors.
The Core of Analyst Ratings: What Every Investor Should Know
Benzinga tracks 150 analyst firms and reports on their stock expectations. Analysts typically arrive at their conclusions by predicting how much money a company will make in the future, usually the upcoming five years, and how risky or predictable that company's revenue streams are.
Analysts attend company conference calls and meetings, research company financial statements, and communicate with insiders to publish their ratings on stocks. Analysts typically rate each stock once per quarter or whenever the company has a major update.
Some analysts publish their predictions for metrics such as growth estimates, earnings, and revenue to provide additional guidance with their ratings. When using analyst ratings, it is important to keep in mind that stock and sector analysts are also human and are only offering their opinions to investors.
Which Stocks Are Analysts Recommending Now?
Benzinga Edge gives you instant access to all major analyst upgrades, downgrades, and price targets. Sort by accuracy, upside potential, and more. Click here to stay ahead of the market.
This article was generated by Benzinga's automated content engine and reviewed by an editor.
- No comments yet. Be the first to comment!