Rotating To Healthcare
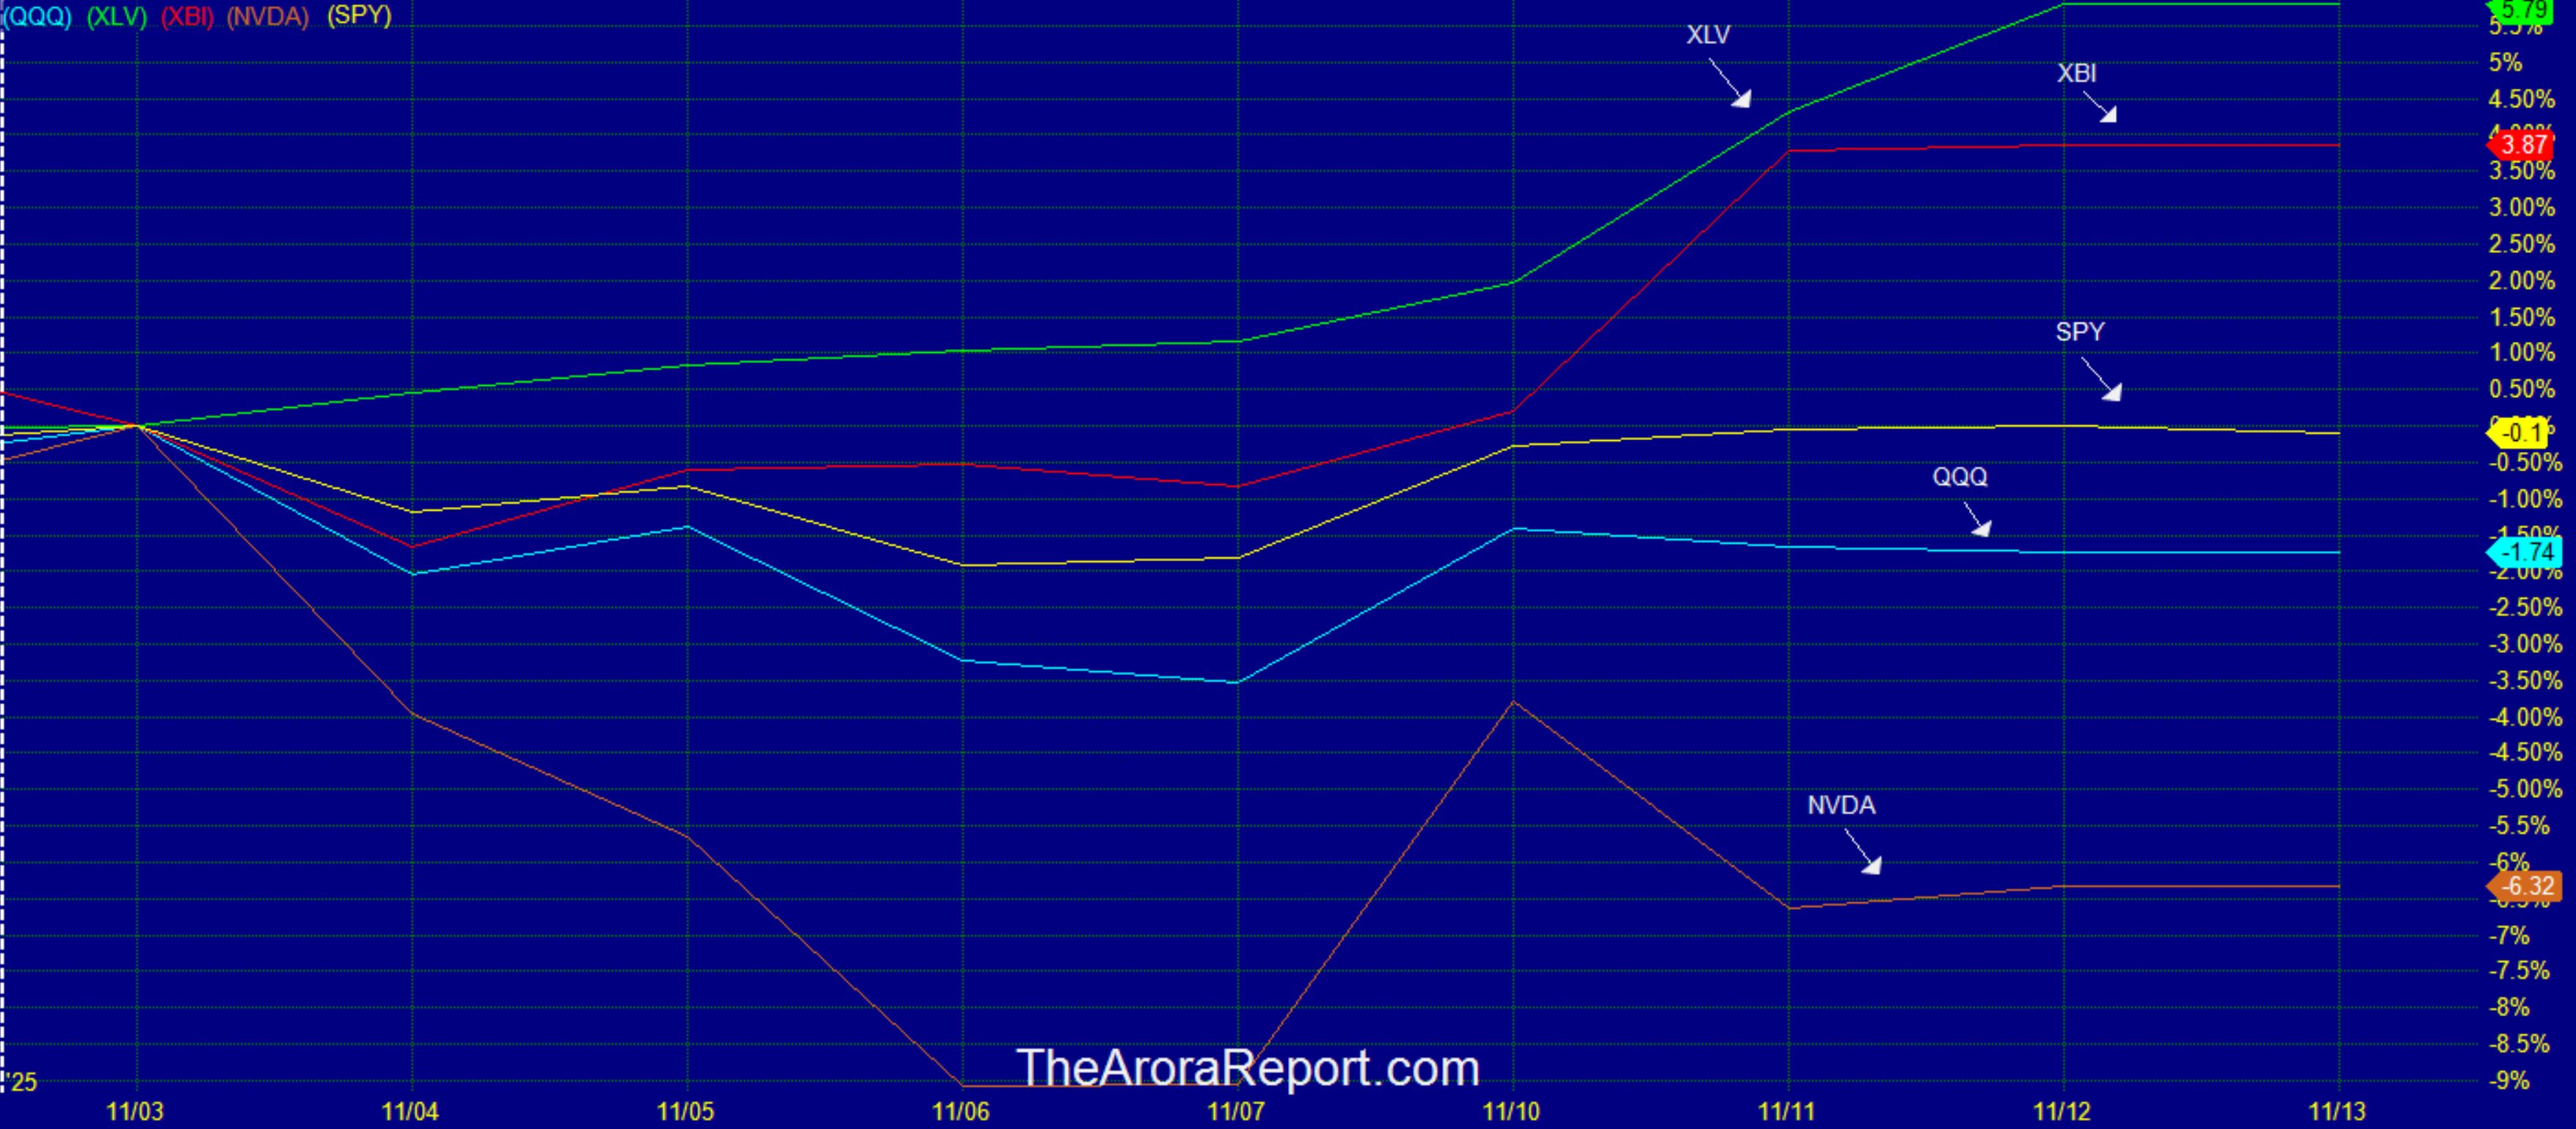
Please click here for an enlarged chart comparing Invesco QQQ Trust Series 1 (NASDAQ:QQQ), SPDR S&P 500 ETF Trust (NYSE:SPY) which represents the benchmark stock market index S&P 500 (SPX), NVIDIA Corp (NASDAQ:NVDA), Health Care Select Sector SPDR Fund (NYSE:XLV), and State Street SPDR S&P Biotech ETF (NYSE:XBI).
Note the following:
- The chart shows healthcare ETF XLV and biotech ETF XBI have outperformed SPY so far this month by 5.8% and 3.88%, respectively.
- The chart shows in November so far QQQ is underperforming compared to SPY.
- The chart shows NVDA stock is underperforming SPY by 6.31% in November.
- As full disclosure, XLV and XBI are in our portfolio.
- As the end of 2025 approaches, money is moving into healthcare and biotech, not AI.
- The momo crowd is still aggressively buying AI stocks, but non-momo investors are concerned that AI stocks are overbought and are diversifying into other sectors. However, investors need to be aware that analysts have been upgrading their earnings expectations for this quarter for tech stocks more than other stocks – 8.7% for tech stocks and 1.9% for non-tech stocks.
- In our analysis, as the year end gets closer, in the absence of any news or data that is negative for AI, expect money managers to buy AI stocks for window dressing purposes.
- We previously wrote:
Here are the main questions for the Fed as it balances inflation and the risks to the labor market:
- Are price increases from tariffs a one time event or will they sustain?
- Is weak hiring an indication of reduced supply or slowed demand?
- Are rates restrictive?
- Prudent investors should pay attention that at this time, four Fed presidents, Goolsbee, Musalem, Collins, and Schmid, are not calling for a rate cut in December.
- In our analysis, there is still better than 50% probability of a rate cut in December, not because the data supports it, but because of intense political pressure. Of course, a deluge of data is ahead.
- The momo crowd has been euphoric about the government reopening. We previously wrote:
- Here is a noteworthy market behavior that is typical of bull markets.
- The stock market did not see selling when the government was initially shut down.
- The stock market is seeing aggressive buying on the prospect of the government opening.
- In a bull market, it is typical for negative news to be ignored and positive news to be bought.
- This morning as the government opens, it is occurring to investors that the stock market did not sell off on the government shutdown and they are wondering why there is euphoria on reopening. The result is many investors are selling into the euphoria.
- Consumer Price Index (CPI) and initial jobless claims will not be released today due to the government shutdown.
Magnificent Seven Money Flows
Most portfolios are now heavily concentrated in the Mag 7 stocks. For this reason, it is important to pay attention to early money flows in the Mag 7 stocks on a daily basis.
In the early trade, money flows are neutral in Meta Platforms Inc (NASDAQ:META), Microsoft Corp (NASDAQ:MSFT), and Apple Inc (NASDAQ:AAPL).
In the early trade, money flows are negative in Amazon.com, Inc. (NASDAQ:AMZN), Alphabet Inc Class C (NASDAQ:GOOG), Nvidia (NVDA), and Tesla Inc (NASDAQ:TSLA).
In the early trade, money flows are negative in S&P 500 ETF (SPY) and Nasdaq 100 ETF (QQQ).
Momo Crowd And Smart Money In Stocks
Investors can gain an edge by knowing money flows in SPY and QQQ. Investors can get a bigger edge by knowing when smart money is buying stocks, gold, and oil. The most popular ETF for gold is SPDR Gold Trust (GLD). The most popular ETF for silver is iShares Silver Trust (SLV). The most popular ETF for oil is United States Oil ETF (NYSE:USO).
Oil
API crude inventories came at a build of 1.3M barrels vs. a consensus of a build of 1.7M barrels.
Bitcoin
Bitcoin (CRYPTO: BTC) has been seeing selling pressure but is range bound as of this writing. Investors are closely watching the psychological support level of $100K.
What To Do Now
Consider continuing to hold good, very long term, existing positions. Based on individual risk preference, consider a protection band consisting of cash or Treasury bills or short-term tactical trades as well as short to medium term hedges and short term hedges. This is a good way to protect yourself and participate in the upside at the same time.
You can determine your protection bands by adding cash to hedges. The high band of the protection is appropriate for those who are older or conservative. The low band of the protection is appropriate for those who are younger or aggressive. If you do not hedge, the total cash level should be more than stated above but significantly less than cash plus hedges.
A protection band of 0% would be very bullish and would indicate full investment with 0% in cash. A protection band of 100% would be very bearish and would indicate a need for aggressive protection with cash and hedges or aggressive short selling.
It is worth reminding that you cannot take advantage of new upcoming opportunities if you are not holding enough cash. When adjusting hedge levels, consider adjusting partial stop quantities for stock positions (non ETF); consider using wider stops on remaining quantities and also allowing more room for high beta stocks. High beta stocks are the ones that move more than the market.
Traditional 60/40 Portfolio
Probability based risk reward adjusted for inflation does not favor long duration strategic bond allocation at this time.
Those who want to stick to traditional 60% allocation to stocks and 40% to bonds may consider focusing on only high quality bonds and bonds of five year duration or less. Those willing to bring sophistication to their investing may consider using bond ETFs as tactical positions and not strategic positions at this time.
**
The Arora Report is known for its accurate calls. The Arora Report correctly called the big artificial intelligence rally before anyone else, the new bull market of 2023, the bear market of 2022, new stock market highs right after the virus low in 2020, the virus drop in 2020, the DJIA rally to 30,000 when it was trading at 16,000, the start of a mega bull market in 2009, and the financial crash of 2008. Please click here to sign up for a free forever Generate Wealth Newsletter.
**
Benzinga Disclaimer: This article is from an unpaid external contributor. It does not represent Benzinga’s reporting and has not been edited for content or accuracy.
- No comments yet. Be the first to comment!