No AI Bubble
Please click here for an enlarged chart of iShares Silver Trust (NYSE:SLV).
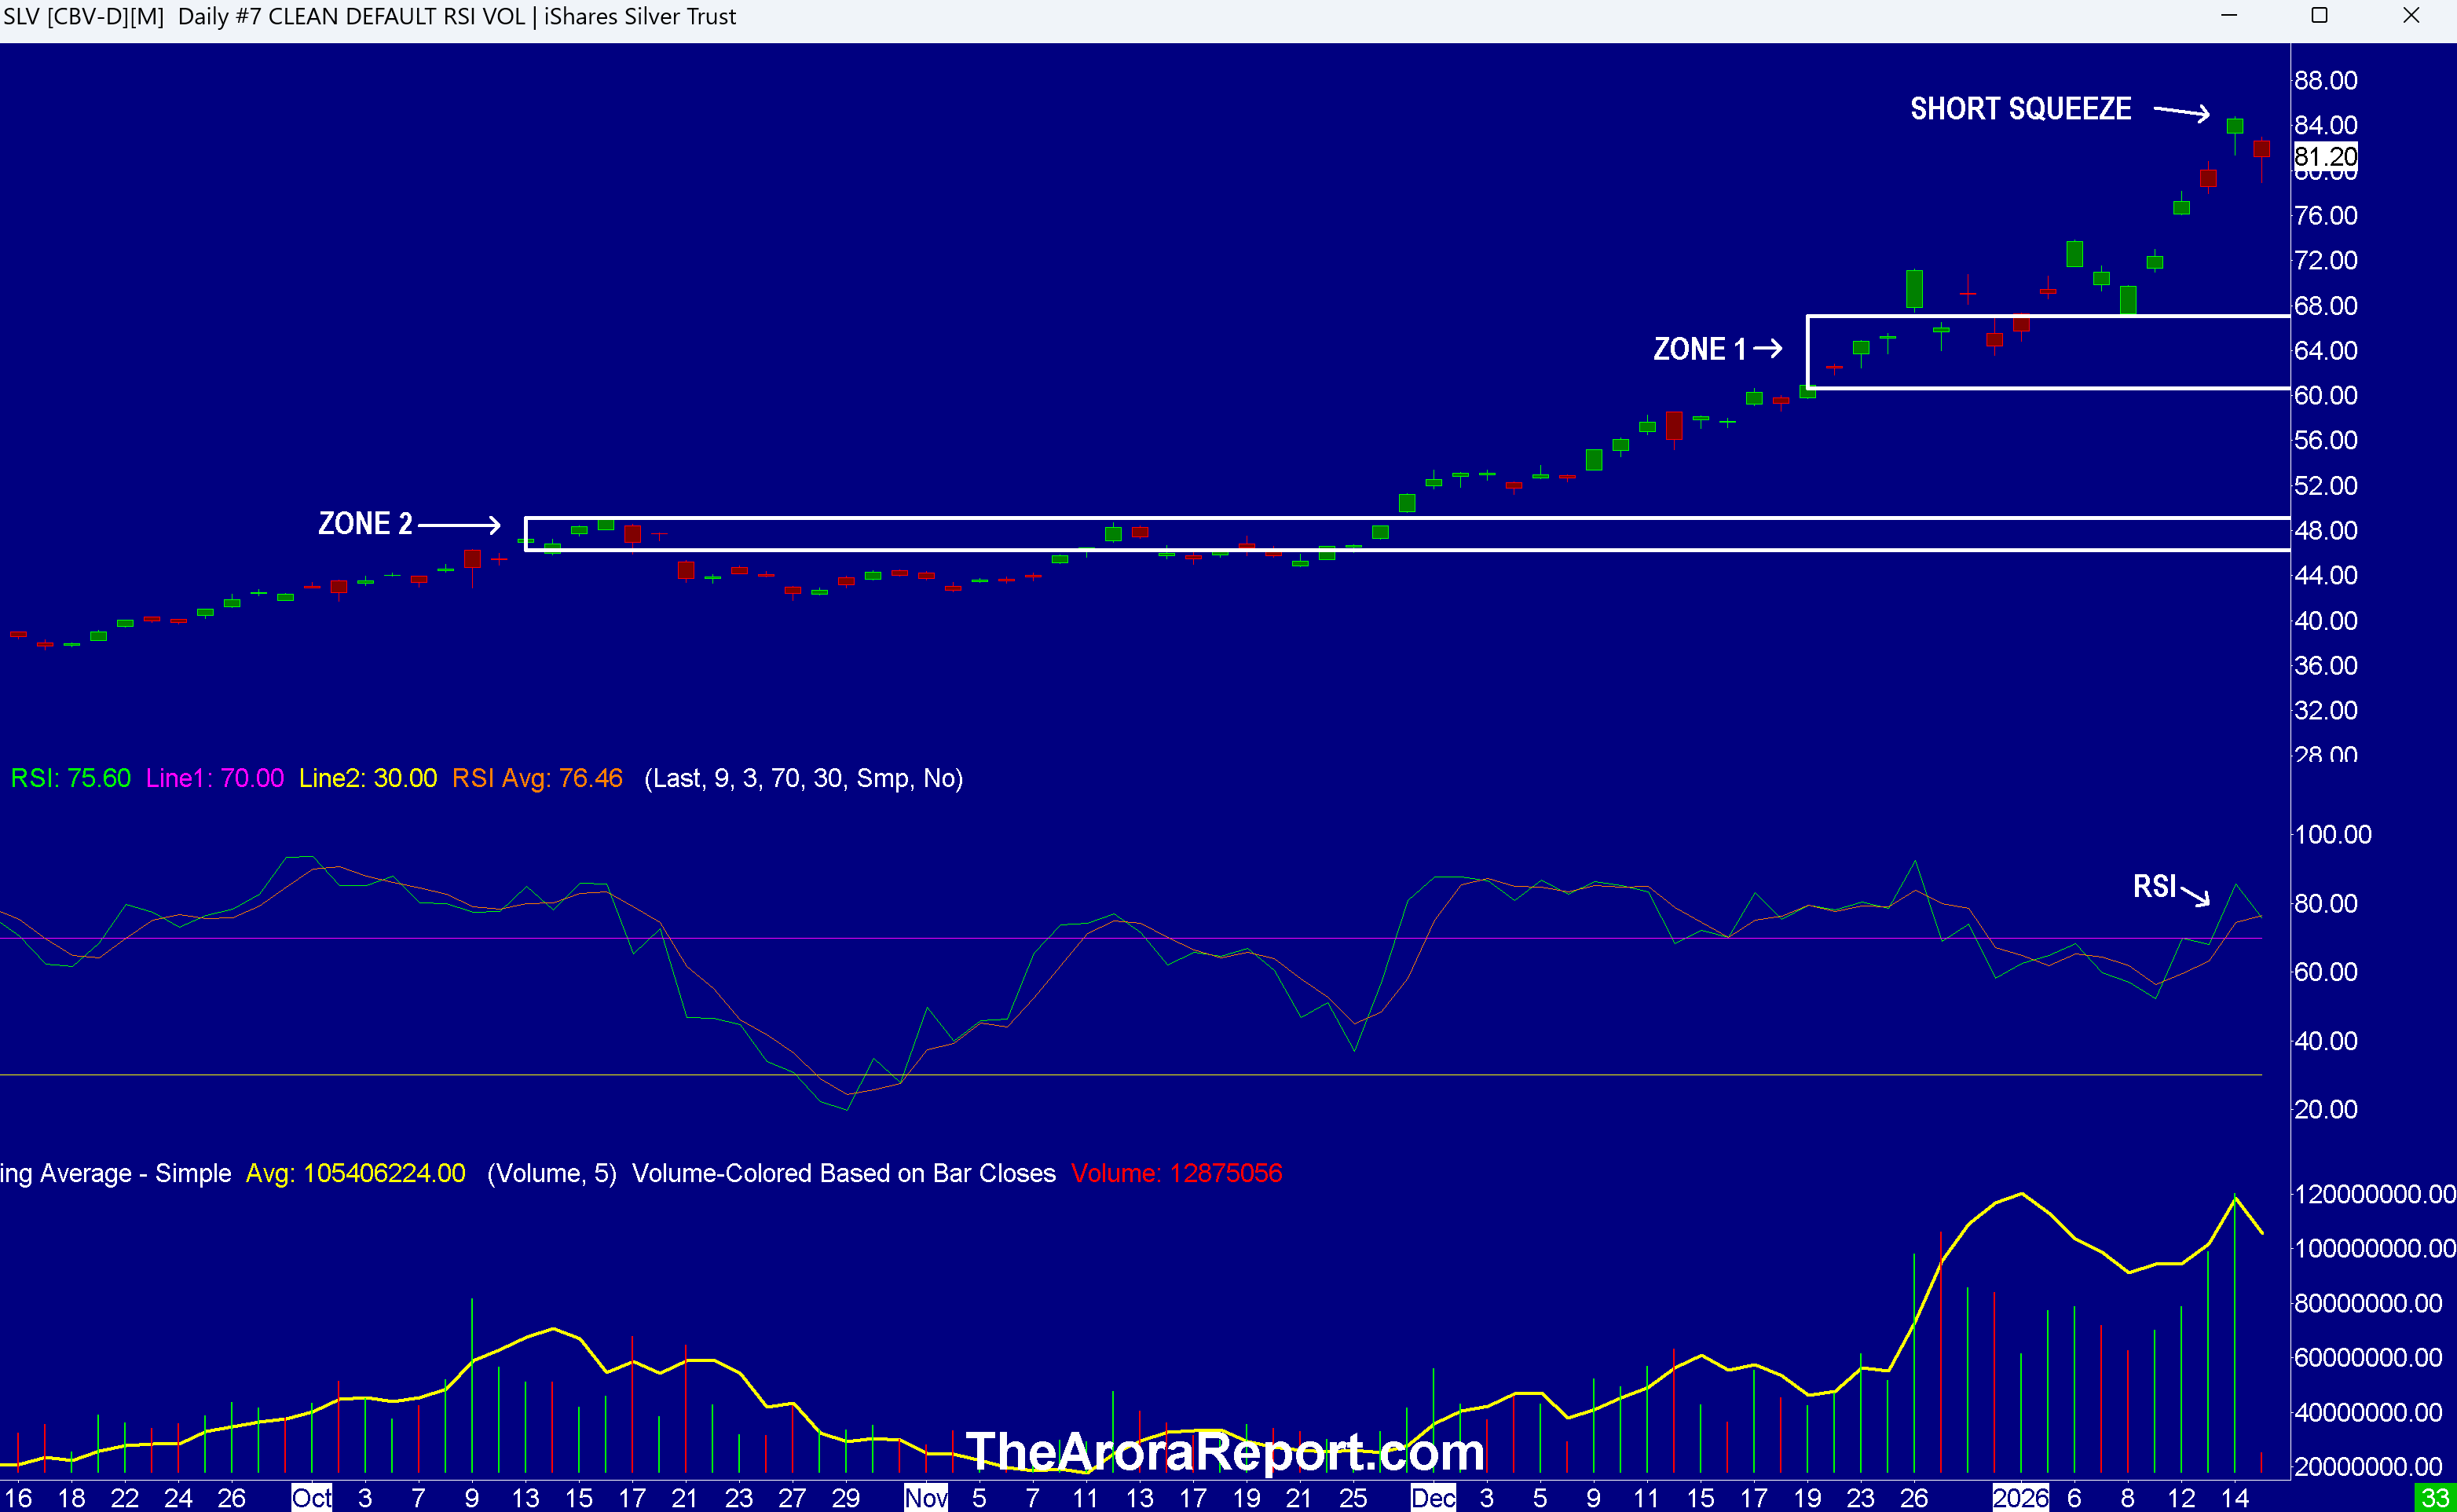
Note the following:
- The chart shows the blistering silver rally.
- The chart shows zone 1 (support). There is a high risk of silver quickly falling to this support zone.
- In our analysis, the main reason behind the latest rally in silver is another leg of short squeeze.
- If there is any new fundamental development, such as the U.S. bombing Iran, another leg of short squeeze can carry silver to $120.
- According to our algorithms, this leg of the silver short squeeze is showing the first signs of ending. This is the most likely scenario without new developments.
- There are also two fundamental drivers that should pull silver down.
- Tensions with Iran are easing. Apparently, President Trump has reached some sort of agreement through diplomatic channels that Iran will stop killing protestors.
- President Trump has postponed tariffs on critical minerals.
- If silver pulls back, other metals such as gold and copper will also likely pull back.
- As full disclosure, we have a number of positions in metals. Here are the positions that we have given signals to take partial profits on: silver ETF SLV long from $13.96, gold ETF SPDR Gold Trust (NYSE:GLD) long from $11.03, gold miner Newmont Corporation (NYSE:NEM) long from $29.90, copper ETF United States Copper Index Fund (NYSE:CPER) long from $28.21, metals and mining ETF State Street SPDR S&P Metals & Mining ETF (NYSE:XME) long from $43.38, copper miner Freeport-McMoRan Inc (NYSE:FCX) long from $30.71, and copper miner First Quantum Minerals Ltd (OTC:FQVLF) long from $9.09.
- In our analysis, earnings from Taiwan Semicndctr Mnufctrng Co Ltd (NYSE:TSM). show that at least for the time being there is no AI bubble. Prudent investors should keep in mind the analysis is based on the data available at this time; it is important to not get locked into an opinion but to stay data dependent. This inference is drawn from the following facts:
- Historically, Taiwan Semiconductor is very careful about increasing capex.
- The latest earnings show that Taiwan Semiconductor is significantly increasing capex.
- Taiwan Semiconductor reported earnings of $3.14 vs. $2.94 consensus.
- Taiwan Semiconductor reported revenues of $33.73B, which represents a 25.5% increase year-over-year.
- Taiwan Semiconductor sees FY26 revenues of $34.6B – $35.8B.
- Taiwan Semiconductor capex plans are helping a rally in semiconductor equipment manufacturing company Applied Materials Inc (NASDAQ:AMAT). AMAT is in tour portfolio and we are long from an average of $16. AMAT is trading up $24.51 at $326.40 as of this writing in the premarket.
- In the early trade, there is aggressive buying in all AI stocks due to blow out earnings from Taiwan Semiconductor.
- Initial jobless claims came at 198K vs. 210K consensus. Jobless claims are a surprise to the downside. Initial jobless claims is a leading indicator and carries heavy weight in our asset allocation model.
Magnificent Seven Money Flows
Most portfolios are now heavily concentrated in the Mag 7 stocks. For this reason, it is important to pay attention to early money flows in the Mag 7 stocks on a daily basis.
In the early trade, money flows are positive in Amazon.com, Inc. (NASDAQ:AMZN), Alphabet Inc Class C (NASDAQ:GOOG), Meta Platforms Inc (NASDAQ:META), Microsoft Corp (NASDAQ:MSFT), NVIDIA Corp (NASDAQ:NVDA), and Tesla Inc (NASDAQ:TSLA).
In the early trade, money flows are neutral in Apple Inc (NASDAQ:AAPL).
In the early trade, money flows are positive in SPDR S&P 500 ETF Trust (NYSE:SPY) and Invesco QQQ Trust Series 1 (NASDAQ:QQQ).
Momo Crowd And Smart Money In Stocks
Investors can gain an edge by knowing money flows in SPY and QQQ. Investors can get a bigger edge by knowing when smart money is buying stocks, gold, and oil. The most popular ETF for gold is SPDR Gold Trust (GLD). The most popular ETF for silver is iShares Silver Trust (SLV). The most popular ETF for oil is United States Oil ETF (USO).
Bitcoin
Bitcoin (CRYPTO: BTC) is seeing buying.
What To Do Now
Consider continuing to hold good, very long term, existing positions. Based on individual risk preference, consider a protection band consisting of cash or Treasury bills or short-term tactical trades as well as short to medium term hedges and short term hedges. This is a good way to protect yourself and participate in the upside at the same time.
You can determine your protection bands by adding cash to hedges. The high band of the protection is appropriate for those who are older or conservative. The low band of the protection is appropriate for those who are younger or aggressive. If you do not hedge, the total cash level should be more than stated above but significantly less than cash plus hedges.
A protection band of 0% would be very bullish and would indicate full investment with 0% in cash. A protection band of 100% would be very bearish and would indicate a need for aggressive protection with cash and hedges or aggressive short selling.
It is worth reminding that you cannot take advantage of new upcoming opportunities if you are not holding enough cash. When adjusting hedge levels, consider adjusting partial stop quantities for stock positions (non ETF); consider using wider stops on remaining quantities and also allowing more room for high beta stocks. High beta stocks are the ones that move more than the market.
Traditional 60/40 Portfolio
Probability based risk reward adjusted for inflation does not favor long duration strategic bond allocation at this time.
Those who want to stick to traditional 60% allocation to stocks and 40% to bonds may consider focusing on only high quality bonds and bonds of five year duration or less. Those willing to bring sophistication to their investing may consider using bond ETFs as tactical positions and not strategic positions at this time.
The Arora Report is known for its accurate calls. The Arora Report correctly called the big artificial intelligence rally before anyone else, the new bull market of 2023, the bear market of 2022, new stock market highs right after the virus low in 2020, the virus drop in 2020, the DJIA rally to 30,000 when it was trading at 16,000, the start of a mega bull market in 2009, and the financial crash of 2008. Please click here to sign up for a free forever Generate Wealth Newsletter.
Benzinga Disclaimer: This article is from an unpaid external contributor. It does not represent Benzinga’s reporting and has not been edited for content or accuracy.
- No comments yet. Be the first to comment!