Sentiment Change Creates Opportunity
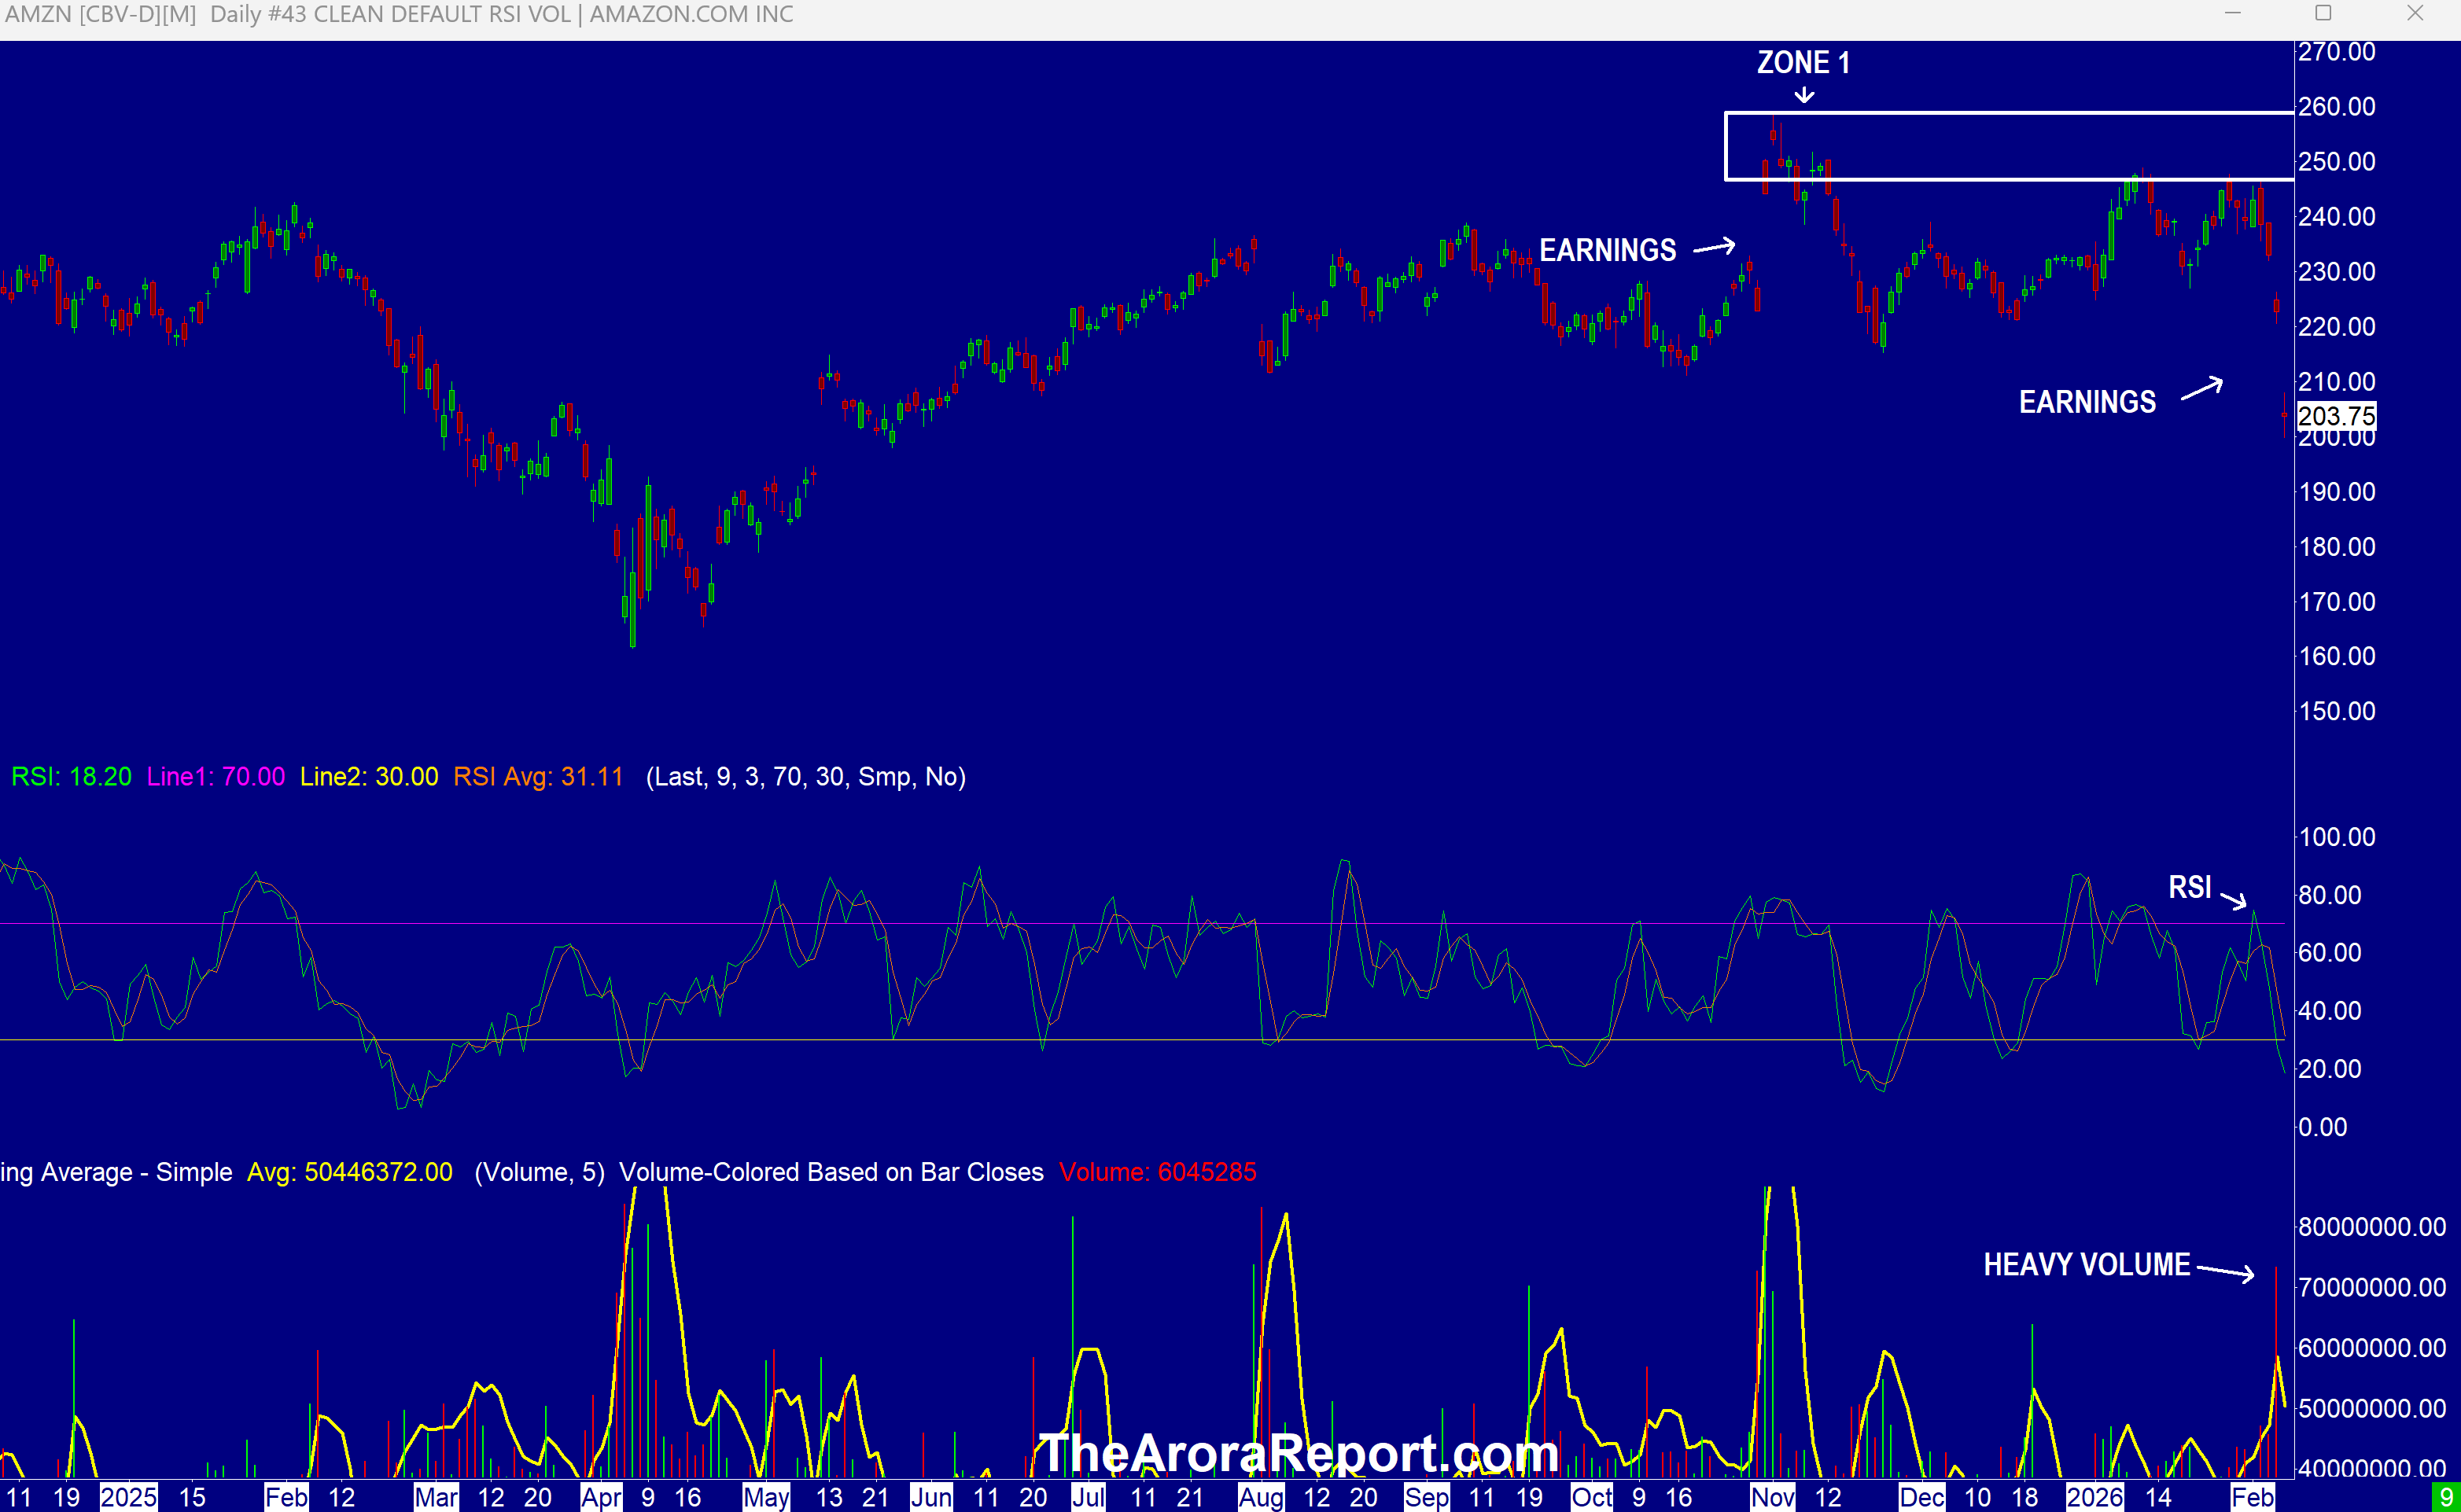
Please click here for an enlarged chart of Amazon.com, Inc. (NASDAQ:AMZN).
Note the following:
- This article is about the big picture, not an individual stock. The chart of AMZN stock is being used to illustrate the point.
- The chart shows AMZN stock was not able to break into zone 1 (resistance).
- The chart shows the drop in AMZN stock on earnings.
- The chart shows the pullback yesterday was on heavy volume. This indicates the move was on conviction.
- RSI on the chart shows AMZN stock is oversold. Oversold stocks tend to bounce.
- The gap down today in AMZN stock has a high probability of being an exhaustion gap. There is a new trade around signal on AMZN stock from us. It is important to scale in in the buy zone. A trade around position is a technique used by hedge funds and billionaires that can dramatically add to returns and lower risks.
- Amazon earnings were below whisper numbers, but the main reason for the drop in the stock is massive capex, primarily on AI. Amazon plans to spend $200B on capex vs. $146B consensus. Amazon is beating Google's jaw dropping capex number that we previously shared with you.
- It is important for investors to shift their thinking as market conditions change. Not long ago, the higher the capital spend, the higher the stocks went. Now, the higher the capital spend, the lower the stocks go.
- Sentiment has turned very negative.
- Tech stocks, especially software stocks, gold, silver, and bitcoin are oversold.
- The combination of sentiment turning very negative and oversold conditions historically lead to a tradeable bottom. However, the bottom may not be enduring as the sentiment has not turned extremely negative.
- There is a fair probability that a short term tactical bounce may occur from here. However, any trade is high risk because market structures are still unstable. Here are the low points as a reference. Short term trades are likely to work if markets stay above the points mentioned below:
- S&P futures 6761
- Nasdaq futures 24,239
- Gold futures $4670
- Silver futures $63.90
- Bitcoin futures $60,005
- As full disclosure, we have given trade around signals on Microsoft Corp (NASDAQ:MSFT) and iShares Expanded Tech-Software Sector ETF (BATS:IGV).
- TrumpRx is now operational. TrumpRx gives consumers access to lower cost drugs from many drug makers including Eli Lilly And Co (NYSE:LLY), Novo Nordisk A/S (NYSE:NVO), Pfizer Inc (NYSE:PFE), AstraZeneca PLC (NYSE:AZN), Merck & Co Inc (NYSE:MRK), and GSK plc (NYSE:GSK). Goodrx Holdings Inc (NASDAQ:GDRX) is a core integration partner for TrumpRx. As full disclosure, yesterday, we gave a signal in our Buy report on GDRX.
Magnificent Seven Money Flows
Most portfolios are now heavily concentrated in the Mag 7 stocks. For this reason, it is important to pay attention to early money flows in the Mag 7 stocks on a daily basis.
In the early trade, money flows are positive in Microsoft Corp (MSFT), NVIDIA Corp (NASDAQ:NVDA), and Tesla Inc (NASDAQ:TSLA).
In the early trade, money flows are neutral in Apple Inc (NASDAQ:AAPL).
In the early trade, money flows are negative in Amazon (AMZN), Alphabet Inc Class C (NASDAQ:GOOG), and Meta Platforms Inc (NASDAQ:META).
In the early trade, money flows are positive in SPDR S&P 500 ETF Trust (NYSE:SPY) and Invesco QQQ Trust Series 1 (NASDAQ:QQQ).
Momo Crowd And Smart Money In Stocks
Investors can gain an edge by knowing money flows in SPY and QQQ. Investors can get a bigger edge by knowing when smart money is buying stocks, gold, and oil. The most popular ETF for gold is SPDR Gold Trust (NYSE:GLD). The most popular ETF for silver is iShares Silver Trust (NYSE:SLV). The most popular ETF for oil is United States Oil ETF (NYSE:USO).
Gold
The momo crowd is selling gold ETF (GLD), silver ETF (SLV), VanEck Gold Miners ETF (NYSE:GDX), and Global X Silver Miners ETF (NYSE:SIL).
Oil
The momo crowd is buying oil ETF (USO).
Bitcoin
Bitcoin (CRYPTO: BTC) is seeing buying.
What To Do Now
Consider continuing to hold good, very long term, existing positions. Based on individual risk preference, consider a protection band consisting of cash or Treasury bills or short-term tactical trades as well as short to medium term hedges and short term hedges. This is a good way to protect yourself and participate in the upside at the same time.
You can determine your protection bands by adding cash to hedges. The high band of the protection is appropriate for those who are older or conservative. The low band of the protection is appropriate for those who are younger or aggressive. If you do not hedge, the total cash level should be more than stated above but significantly less than cash plus hedges.
A protection band of 0% would be very bullish and would indicate full investment with 0% in cash. A protection band of 100% would be very bearish and would indicate a need for aggressive protection with cash and hedges or aggressive short selling.
It is worth reminding that you cannot take advantage of new upcoming opportunities if you are not holding enough cash. When adjusting hedge levels, consider adjusting partial stop quantities for stock positions (non ETF); consider using wider stops on remaining quantities and also allowing more room for high beta stocks. High beta stocks are the ones that move more than the market.
Traditional 60/40 Portfolio
Probability based risk reward adjusted for inflation does not favor long duration strategic bond allocation at this time.
Those who want to stick to traditional 60% allocation to stocks and 40% to bonds may consider focusing on only high quality bonds and bonds of five year duration or less. Those willing to bring sophistication to their investing may consider using bond ETFs as tactical positions and not strategic positions at this time.
The Arora Report is known for its accurate calls. The Arora Report correctly called the big artificial intelligence rally before anyone else, the new bull market of 2023, the bear market of 2022, new stock market highs right after the virus low in 2020, the virus drop in 2020, the DJIA rally to 30,000 when it was trading at 16,000, the start of a mega bull market in 2009, and the financial crash of 2008. Please click here to sign up for a free forever Generate Wealth Newsletter.
Benzinga Disclaimer: This article is from an unpaid external contributor. It does not represent Benzinga’s reporting and has not been edited for content or accuracy.
- No comments yet. Be the first to comment!