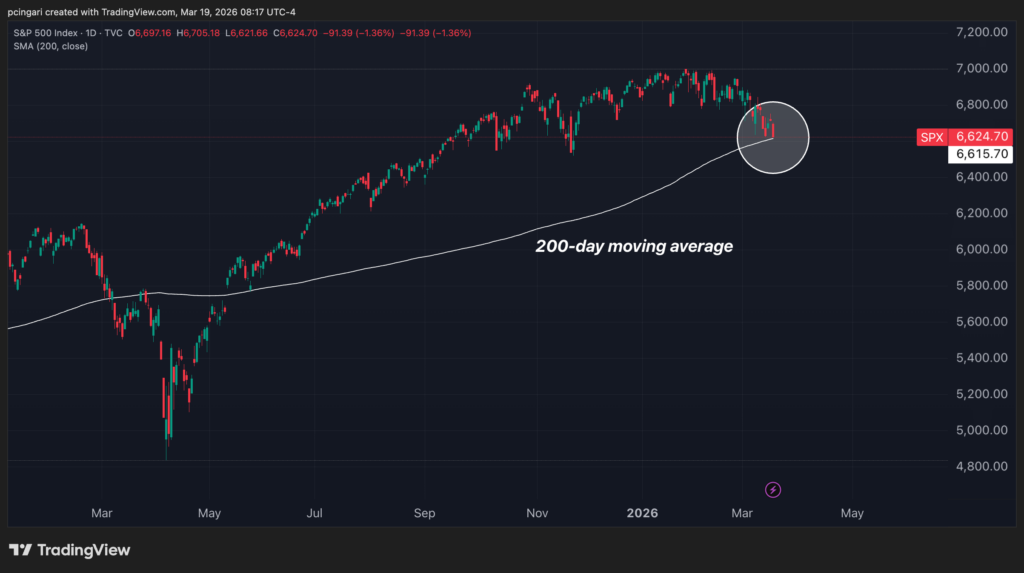
Both the S&P 500 and Nasdaq 100 are poised to break below their 200-day moving averages for the first time since March 2025.
Meanwhile, the Brent-WTI crude spread blew out to $17 per barrel early Thursday — the widest since April 2020 when WTI went negative — as Israel’s strike on Iran’s South Pars gas field triggered retaliatory missile attacks across the Gulf and markets began pricing in the risk of U.S. crude export restrictions.
Brent surged 7.11% to $115.01, while Middle East benchmarks Murban and Dubai crude exploded above $128 and $136 respectively.
Chart Of The Day
S&P 500 Could Break Below Its 200-Day Moving Average For First Time Since March 2025
Iran War Day 20: What Happened In The Last 24 Hours
- President Donald Trump said Israel “violently lashed out” at Iran’s South Pars gas field and that the U.S. “knew nothing about this particular attack.” He warned that the U.S. would “massively blow up the entirety of the South Pars gas field” if Qatar’s LNG is attacked again, and demanded no further Israeli strikes on the site unless Iran retaliates against Qatar.
- Iran retaliated with ballistic missiles against Qatar’s Ras Laffan LNG complex, which handles roughly 20% of global LNG supply. Qatar reported fires and extensive damage. Iranian drones also hit the Samref refinery in Yanbu, Saudi Arabia, and the Mina Al-Ahmadi refinery in Kuwait.
- The Fed held rates at 3.5%-3.75% in an 11-1 vote. The dot plot projects one cut in 2026. Chair Jerome Powell emphasized oil-shock uncertainty and said inflation progress had stalled.
Thursday’s Oil Market Update
WTI crude oil futures — as tracked by the United States Oil Fund (NYSE:USO) — traded at $98.35 per barrel early Thursday, up $2.03 (+2.11%). Since the start of the war on Feb. 28, WTI prices have surged roughly 45% from a pre-war level near $68 per barrel.
Brent crude — tracked via the United States Brent Oil Fund, LP ETV (NYSE:BNO) — jumped 7.11% to $115.01 per barrel following Iranian missile strikes on Gulf energy infrastructure.
Middle East benchmarks saw even sharper moves: Murban crude surged 10.34% to $128.84 per barrel, while Dubai crude spiked 11.05% to $136.42 per barrel, reflecting an acute physical supply squeeze in the region.
The Brent-WTI spread widened to approximately $17 per barrel — the widest since April 2020, when WTI famously went negative amid the pandemic storage crisis. Excluding that historic anomaly, the current spread is the widest since November 2023.
The blowout signals that markets are beginning to price in the risk of U.S. crude export restrictions, as international buyers scramble for non-Gulf supply while U.S. production remains insulated from the disruption at Hormuz.
A widening Brent-WTI spread historically reflects divergent supply and demand dynamics between the Atlantic Basin and the rest of the world.
Chart: WTI-Brent Spread Widens To 2020 Levels

The natural gas market told a similar story.
European TTF natural gas prices spiked 17% to €63 per megawatt-hour following the strike on Qatar’s Ras Laffan complex — equivalent to roughly $21.17 per million British thermal units.
U.S. Henry Hub natural gas – as tracked by the United States Natural Gas Fund LP (NYSE:UNG) rose 4.73% to $3.21 per MMBtu.
The resulting transatlantic spread of roughly $18 per MMBtu is the widest since February 2023, underscoring the acute vulnerability of European energy markets to disruptions in Middle Eastern LNG supplies.
Iran War And Macro Impacts: What Prediction Markets Say
- Strait of Hormuz traffic returns to normal by April 30: 26%. Traders on Polymarket assign only a one-in-four chance that shipping through the strait normalizes within six weeks. The overnight attacks on Gulf refineries in Saudi Arabia and Kuwait reinforce the view that energy transit risks are deepening rather than receding.
Kharg Island no longer under Iranian control by March 31: 12%. Despite the U.S. bombing of military targets on Kharg Island on March 13, Polymarket traders see just a 12% probability that Iran will lose control of the island by month-end. The April 30 deadline trades at 32%.
Military action against Iran continues through March 31: 91%. The market assigns just a 9% chance the war ends by March 31. The overnight Gulf escalation and continued Israeli assassinations of senior Iranian officials have cemented the consensus that the conflict will extend well into the spring.
March U.S. inflation (annual) at or above 2.8%: 96.9%. The oil shock has made elevated inflation a near-certainty for the March reading, with traders assigning less than 1% probability to any outcome below 2.8%.
Fed rate cuts in 2026 — 1 cut leads at 33%, 0 cuts at 29%. Polymarket traders are closely split between one rate cut (33%) and zero cuts (30%), with two cuts at 19% and three or more at just 9%. The hawkish hold and oil-driven inflation expectations have pushed the “no cuts” outcome sharply higher.
Latest Commentary From Wall Street Analysts
- Goldman Sachs now characterizes the Iran war as the largest oil supply shock on record, with Persian Gulf exports reduced to about 3% of normal levels. Daan Struyven, head of oil research, assumes Hormuz will operate at just 10% of normal flows for 21 days, followed by a 30-day gradual recovery. Goldman expects the war to reduce global growth by 0.3% of GDP while adding 0.5-0.6 percentage points to headline inflation. Goldman also warned that the stock market is underestimating Iran war risk after Monday’s bounce.
- J.P. Morgan warned that strategic oil reserves can cover only 7.5% of the Hormuz supply shock, estimating a coordinated G7 release would address just 7.5% of the roughly 16 million barrels per day shortfall. If Brent remains elevated through mid-year, first-half 2026 global GDP growth could be depressed by an annualized 0.6%, with global CPI rising more than 1 percentage point.
- The Kobeissi Letter flagged that S&P 500 futures liquidity has collapsed to just $5.1 million, near the lowest since April 2025’s “Liberation Day” shock. Top-of-book depth has fallen 80% year-to-date and sits 61% below the historical average of roughly $13 million. Gulf producers have cut oil production by 10 million barrels a day.
Global Market Snapshot: Key Levels To Watch
- S&P 500 futures traded at 6,600.91, down 0.36%, after the index closed at 6,624.70 on Wednesday. The 200-day moving average sits at 6,615 — if the index opens near current futures levels, it will break below the 200-day for the first time since March 2025.
- Nasdaq 100 futures fell 0.44% to 24,316, with the 200-day moving average at 24,333 — also at risk of a breakdown not seen in a year. Dow Jones futures declined 0.25% to 46,108. Japan’s Nikkei 225 plunged 5.06%, leading a broad global rout. Energy remains the only S&P sector in positive territory year-to-date.
- Bonds: The 10-year Treasury yield rose to 4.29%, up 2.7 basis points. A break above 4.31% would mark the highest level since August 2025. The Fed’s hawkish hold and elevated producer prices data kept yields firm despite geopolitical uncertainty.
- Gold: Gold futures tumbled to $4,655 per ounce and broke below the 50-day moving average on Wednesday. The 100-day moving average now sits at $4,577 — a level gold has traded above since December 2024. Spot gold traded at $4,682.85, down $208.38 (-4.26%) on the day. The sell-off comes despite overnight Gulf escalation and likely reflects forced liquidation and margin calls across risk assets.
- Currencies: The DXY dollar index held at 100.13, up 0.04%, supported by the Fed’s hawkish stance. EUR/USD traded at 1.1468, up 0.14%. USD/JPY fell 0.48% to 159.08 as the yen strengthened modestly on risk-off flows despite energy import cost fears.
- CBOE Volatility Index (VIX): The VIX traded at 26.03 early Thursday, up 0.94 points (+3.74%) from Wednesday’s close of 25.09, which itself had surged 12.16% on the session. The index has spiked from a mid-teens baseline at the start of the year.
Image: Shutterstock
Login to comment