Snap Inc. (NYSE:SNAP) is moving higher on Tuesday, with shares finding support around the $3.90 level. A classic reversal pattern formed, suggesting a continued move higher. This is why Benzinga made Snap the Stock of the Day.
Many analysts and traders try to identify patterns on charts without understanding why these patterns appear.
Markets are always going up, down, or sideways. When leadership shifts from bears to bulls or from bulls to bears, price action can appear on a chart as a reversal pattern.
For example, if the change is slow and occurs over an extended period, a ‘rounded top' or ‘rounded bottom' may appear. If it occurs after testing resistance or support two or three times, a double or triple bottom or top may form.
The names of the patterns are not important. What is important is what the pattern illustrates.
On Snap’s chart, a classic Japanese candlestick ‘morning star' has appeared. This is also a reversal pattern indicating a move higher.
The stock was in a downtrend. The bears were firmly in control. When these sellers capitulated, a major, final move lower ensued.
This is the big red candlestick on the chart. See below.
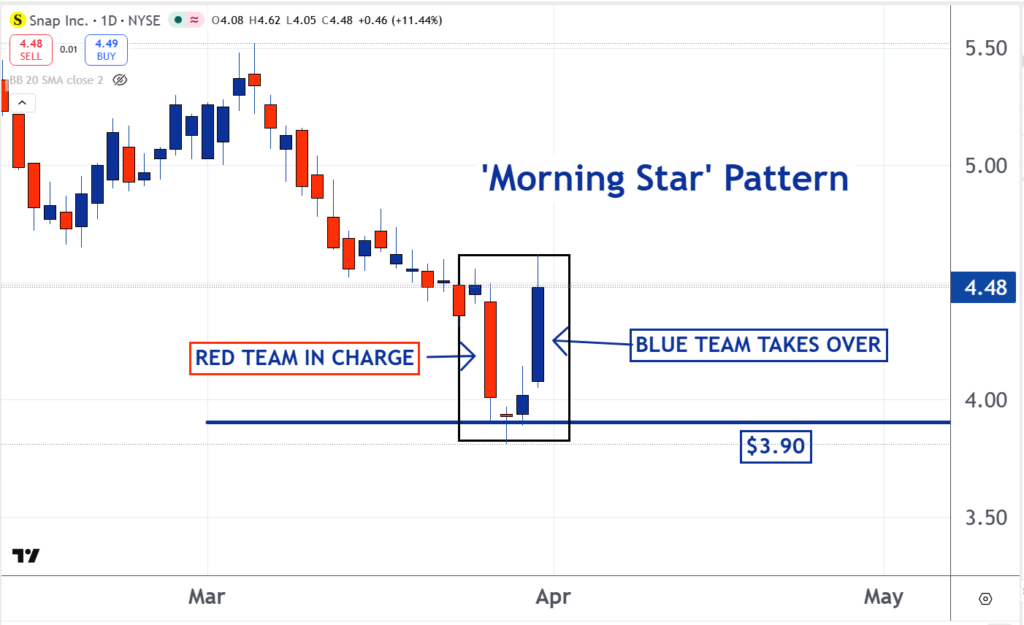
Then for two days, the forces of supply and demand were equalized. This is why the next two candles on the chart were so small.
If markets are out of equilibrium in one direction, and then they shift to being out of equilibrium in the other direction, there will be a brief period where they are in equilibrium. The forces of supply and demand are the same.
This is why there was so little movement on these two days.
Now the tide seems to have turned. The bulls have taken control. This is illustrated by the big blue candle.
Successful traders understand that the names of the patterns are not important. But the market dynamics and trading action they illustrate are. This understanding leads to profit opportunities.
Image: Shutterstock
Login to comment