Market Overview
Stocks finished notably higher during the shortened trading week, and despite geopolitical tensions remaining elevated, leadership came from all the right places. Technology finally came back alive as the energy sector was crushed. This occurred despite oil's surge into the weekend. The Nasdaq led the rally higher, finishing up 4.44%. The S&P 500 followed, climbing 3.36%, while the Dow Jones Industrial Average finished 2.96% higher. Could this be a similar mid-term year/holiday trading setup to what we experienced in Trump's first term when the market bottomed on Christmas Eve in 2018?
Stocks I Like
Marvell Technology (MRVL) – 40% Return Potential

What's Happening
- Marvell Technology, Inc. (MRVL) is a leading fabless semiconductor company designing and developing high-performance data infrastructure solutions for storage, networking, compute, and automotive applications, powering AI, cloud computing, 5G, and edge technologies, offering investors exposure to the rapidly growing semiconductor and artificial intelligence sector with a focus on innovative silicon solutions and connectivity.
- The company generated revenue of $2.22 billion and earnings of $685.1 million last quarter.
- The valuation in MRVL is rather high. P/E is at 28.60, Price-to-Sales is at 9.32, and EV to EBITDA is at 17.39.
- At a technical level, MRVL is pressing up against resistance of a wedge formation. If it clears, look out above as it's poised to rip.
Why It's Happening
- Marvell Technology Inc. is powering the AI data center revolution with its end-to-end connectivity solutions, from high-speed SerDes and optical DSPs to data center switches and custom silicon that keep hyperscale clusters running at unprecedented scale and efficiency. As AI workloads explode and connectivity becomes the primary bottleneck in modern data centers, Marvell's portfolio is enabling the next wave of hyperscaler infrastructure buildouts, positioning the company as an indispensable enabler in the multi-trillion-dollar AI economy.
- Explosive data center momentum is transforming Marvell's business, with this segment now driving the majority of revenue and delivering consistent double-digit growth as demand for 800G and 1.6T interconnects accelerates. By supplying the critical "plumbing" that moves massive amounts of data between GPUs and across racks, Marvell is capitalizing on the structural shift toward AI-native computing and building a durable, high-margin growth engine that extends far beyond traditional semiconductor cycles.
- Strategic acquisitions like Celestial AI are unlocking new frontiers in photonic and optical interconnect technology, directly addressing power and bandwidth challenges in massive AI training clusters. This move, alongside innovations in CXL and co-packaged optics, expands Marvell's addressable market and creates a compelling narrative of evolving from a connectivity leader into a full-stack AI infrastructure partner for the world's largest cloud providers.
- Custom silicon and ecosystem partnerships deepen Marvell's integration with hyperscalers, where its ASICs and advanced networking chips are being designed into next-generation AI systems. Through live demonstrations and collaborations at major industry events, the company is showcasing real-world performance in hyperscale environments, fostering long-term design wins and recurring revenue as customers scale their AI deployments.
- Diversified yet focused portfolio across AI infrastructure, networking, and high-performance computing provides resilience while concentrating on the fastest-growing segments of the semiconductor market. As enterprises and cloud giants continue to invest heavily in AI, Marvell's technology is becoming foundational to the infrastructure layer that powers everything from training clusters to inference at scale, cementing its role in the ongoing digital transformation.
- Analyst Ratings:
- JP Morgan: Overweight
- Craig-Hallum: Buy
- B. Riley Securities: Buy
My Action Plan (40% Return Potential)
- I am bullish on MRVL above $85.00-$87.00. My upside target is $150.00-$155.00.
Fresh Del Monte Produce (FDP) – 36% Return Potential
What's Happening
- Fresh Del Monte Produce Inc. (FDP) is a leading vertically integrated producer, marketer, and distributor of fresh and prepared fruits and vegetables, including pineapples, bananas, melons, and value-added packaged products, offering investors exposure to the rapidly growing global food and agribusiness sector with a focus on sustainable sourcing, supply chain efficiency, and high-quality fresh produce solutions.
- The last quarterly report had revenue of $1.02 billion and earnings of $33.2 million.
- Valuation is mixed in FDP. P/E is at 21.94, Price-to-Sales is at 0.46, and EV to EBITDA is at 10.57.
- From a technical standpoint, FDP is correcting within a descending channel. This implies an eventual continuation of the bull trend in this stock.
Why It's Happening
- Fresh Del Monte Produce Inc. is executing a historic brand unification through its March 2026 acquisition of select Del Monte Foods assets for approximately $285 million, reuniting the iconic Del Monte® name under single ownership for the first time in nearly four decades. This transformative deal expands the company's platform into higher-margin packaged and prepared foods while leveraging global scale, operational synergies, and enhanced brand consistency to drive long-term consumer reach and efficiency gains across fresh and value-added categories.
- Robust operational execution and margin recovery are strengthening Fresh Del Monte's financial foundation, with Q4 2025 results showing improved gross margins, strong operating cash flow of $245 million for the year, and disciplined debt reduction to $173 million. This focus on efficiency, combined with the recent divestiture of non-core assets like Mann Packing, creates a leaner, more resilient business poised to generate sustainable cash flow and support consistent shareholder returns.
- Strategic portfolio streamlining and innovation position Fresh Del Monte to capture growth in the expanding healthy foods market, where demand for fresh produce and convenient packaged options continues to rise. By aligning fresh fruit and vegetable leadership with new prepared-food capabilities, the company is building a diversified, high-quality offering that meets evolving consumer preferences for nutritious, ready-to-eat solutions while enhancing pricing power and household penetration.
- Commitment to shareholder value through reliable dividends and share repurchases underscores Fresh Del Monte's disciplined capital allocation. Maintaining a $0.30 quarterly dividend alongside recent buybacks reflects management confidence in the balance sheet and cash-generating ability, appealing to investors seeking stable returns in the consumer staples sector amid a unified brand strategy that promises future upside.
- Compelling re-rating potential highlights Fresh Del Monte's undervalued growth story, with analysts pointing to intrinsic value well above current levels driven by brand unification, margin expansion, and modest 2026 sales growth guidance of 1-2%. As the company integrates the acquired assets and realizes synergies, it is transitioning into a stronger, more integrated player in the global food industry, creating a narrative of sustainable value creation for long-term investors.
- Analyst Ratings:
- Sidoti & Co: Neutral
- CL King: Buy
My Action Plan (36% Return Potential)
- I am bullish on FDP above $34.00-$35.00. My upside target is $56.00-$58.00.
Antero Resources (AR) – 50% Return Potential
What's Happening
- Antero Resources Corporation (AR) is a leading independent oil and natural gas company focused on the exploration, development, and production of natural gas, natural gas liquids (NGLs), and oil primarily in the Appalachian Basin’s Marcellus and Utica shale plays, offering investors exposure to the rapidly growing domestic energy production and natural gas sector with a focus on low-cost operations, efficient drilling, and sustainable resource development.
- The company's last quarterly report showed revenue of $1.41 billion and earnings of $132.86 million.
- Valuation in AR is far. P/E is at 21.78, Price-to-Sales is at 2.75, and EV to EBITDA is at 9.94.
- From a charting perspective, AR has built a huge saucer base and is trying to break above resistance. Another strong leg higher would be bound to follow.
Why It's Happening
- Antero Resources Corporation is executing a transformative scale-up through its early 2026 acquisition of HG Energy's assets, instantly expanding its Marcellus Shale footprint and lifting 2026 production guidance to 4.1 Bcfe/d while targeting 4.3 Bcfe/d in 2027. This strategic move creates one of the largest pure-play Appalachian producers with enhanced low-cost inventory and operational synergies that position the company to capture meaningful market share in a structurally undersupplied natural gas market.
- Premium access to LNG and export markets drives superior pricing and cash flow resilience. With 75% of its natural gas delivered directly to Gulf Coast LNG fairways and 50% of NGLs exported globally, Antero benefits from rising international demand for U.S. energy, creating a durable revenue advantage that insulates the company from domestic volatility and aligns it with long-term global energy security trends.
- Strong structural tailwinds from domestic demand growth fuel Antero's long-term outlook. Surging needs from data centers, AI-driven power consumption, and coal-to-gas conversions are projected to add tens of Bcf/d of demand through 2030, while industry-wide supply restraint sets the stage for tighter balances—placing Antero's low-cost, high-volume Marcellus assets at the center of this multi-year growth cycle.
- Integrated midstream ownership and capital discipline enhance Antero's cash generation potential. Its 29% stake in Antero Midstream, combined with a focused $1 billion D&C capital plan for 2026 (including targeted growth spending), supports efficient production scaling, reduced operating costs, and strong free cash flow that can be directed toward debt reduction, returns, or further opportunistic expansion.
- Proven operational execution underscores Antero's ability to deliver consistent results. Record drilling and completion efficiency—such as 16.1 stages per day in recent quarters—demonstrates the company's ability to maximize output from its premium inventory, building investor confidence in its capacity to navigate commodity cycles while steadily growing production and margins in a recovering natural gas environment.
- Analyst Ratings:
- Truist Securities: Buy
- Barclays: Equal-Weight
- Benchmark: Buy
My Action Plan (50% Return Potential)
- I am bullish on AR above $37.00-$38.00. My upside target is $60.00-$62.00.
Market-Moving Catalysts for the Week Ahead
The Cure for High Prices is High Prices
Given what's been going on in the commodity markets, it's worth remembering the old market adage, “The cure for high prices is high prices,” as it captures a core self-correcting mechanism in markets and trading.
When prices rise sharply due to strong demand or constrained supply, they act as a powerful signal: producers ramp up output, new competitors enter the market, and traders/investors deploy capital to arbitrage or short the asset, flooding supply.
At the same time, buyers will curb consumption, seek substitutes, or delay purchases, further eroding demand. This dual pressure—expanded supply and contracted demand—inevitably drives prices back lower, often without external intervention, but it can take time. The principle explains why prolonged commodity spikes or stock bubbles rarely persist indefinitely in open markets; high prices themselves sow the seeds of their own reversal.
President Trump's Speech Falls Flat
The market's response, or lack thereof, to President Trump's speech last week suggests that much of the geopolitical risk may already be priced into the market. Once major flashpoints—trade wars, regional conflicts, sanctions regimes, or election uncertainties—become widely anticipated and discussed, traders and algorithms rapidly embed those probabilities into asset prices.
Equity valuations have already compressed notably, and we may have even experienced a false-breakdown at the start of last week. We can see how by the time headlines dominate the news cycle, much of the expected downside has already been discounted; what remains unpriced is primarily the unknown magnitude, duration, or second-order consequences of the event.
While the market's "geopolitical risk gauge" is not zero, people are already bracing for the worst. Remember, we had a big market drop in 2018 during Trump's first term, and it was a mid-term year. It bottomed on Christmas Eve, or around a market holiday. It's not much different than the current setup we have now.
Sector & Industry Strength
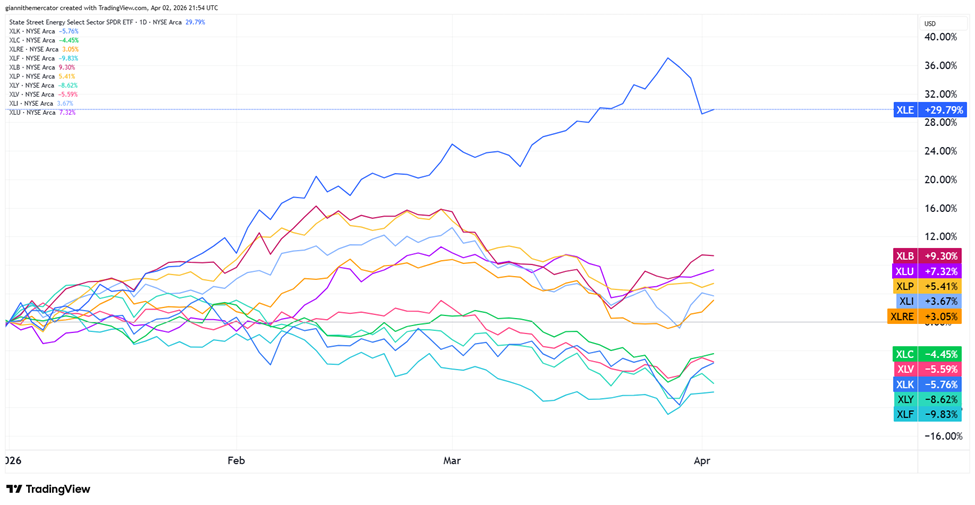
While there were some notable short-term shifts in the sector leaderboard last week, the big picture remains in dire need of repair. The top-performing sector year-to-date remains energy (XLE) by a wide margin, even with last week's sharp pullback.
The inflation trade is still running the tape, with sectors like basic materials (XLB) and consumer staples (XLP) showing relative strength. The most bulls can hope for now is for the rise in these names to pause.
All of the growth sectors are still at the bottom of the pack. That includes technology (XLK), consumer discretionary (XLY), communications (XLC), and financials (XLF). Last week's pop was a step in the right direction, but I still need to see more to truly give the all clear.
| 1 week | 3 Weeks | 13 Weeks | 26 Weeks |
| Technology | Energy | Energy | Energy |
Editor's Note: Well, well, well – is tech finally back?
A Big Moment for Small Cap Tech (Sector ETF: PSCT/XLK)
In addition to the opportunities in quantum computing, there's another emerging theme within the broader technology sector. I have the ratio between small cap tech stocks (PSCT) and large cap tech stocks (XLK) displayed below.
In general, small cap stocks outperformed large cap stocks for years. The biggest theme in the bull market has been large cap tech, but since October, the mega-cap tech names have underperformed and dragged the broader market down with it.
This ratio shows a rounding bottom pattern. The ratio is testing the upper horizontal trendline acting as resistance. If this clears, then a new era of small cap tech leadership may be upon us. This will be home to some tremendous gains.

Chips Continue Signaling Confidence (Sector ETF: SMH/QQQ)
With everything going on, it would be wise to check back in on the most important chart driving this bull market: the ratio between semiconductors (SMH) and the Nasdaq 100 (QQQ). The theme here is artificial intelligence, and chips are leading the way.
The ratio maintains a clear uptrend with a series of higher-highs and higher-lows. It pulled back hard a couple weeks ago, but formed yet another higher-low, which only serves to reinforce the bull trend in favor of the bulls.
The breakout from the wedge pattern at the end of last year tells the real story. Disregard the rest of the noise. As long as this ratio keeps rising, the market is offering gifts in terms of dip-buying opportunities.
Corporate Spreads Hold Up (Sector ETF: LQD/IEI)
There's been a lot of talk about market liquidity as of late. Stocks have teetered on the edge of an abyss, but credit spreads never fully blew out – this has helped put a floor in the selloff, and it's also helped it drag on.
I'm back to looking at the ratio between investment-grade corporate debt (LQD) and 3-7 Year Treasuries (IEI). This ratio has trading within massive saucer formation for years. Saucers are momentum patterns, and typically favor resolutions to the upside in time, but realistically, we're unlikely to see a big break unless the Fed moves sometime soon.
Ever since late-October, this ratio has been steadily drifting lower. But it hasn't collapsed, and this fact alone has prevented stocks from experiencing a sharp decline. If credit spreads blow out, it opens the door for a sharp pullback and reset in stocks. If it starts to climb higher meaningfully again, which cannot be ruled out as a higher-low is in play, then it's very likely the correction is over.
Cryptocurrency
The numerous questions facing stocks are also present in crypto, especially Bitcoin. Prices remain in the corrective downtrend that started in the fall, despite attempts to repair the trend in the past couple weeks.
There have been a short series of higher-highs and higher-lows, but Bitcoin has largely remained within the rectangle formation shown on the chart above. As a rule, consolidations of the losses are considered to be bearish price action.
This leaves the door open for another leg lower down to 53,000-56,000, but in the even prices start to clear the upper trendline of the formation, a test of the 80,000-82,000 could be in play. If that were to clear, we'd have to start considering the possibility of a low being complete.
Legal Disclosures:
This communication is provided for information purposes only.
This communication has been prepared based upon information, including market prices, data and other information, from sources believed to be reliable, but Benzinga does not warrant its completeness or accuracy except with respect to any disclosures relative to Benzinga and/or its affiliates and an analyst’s involvement with any company (or security, other financial product or other asset class) that may be the subject of this communication. Any opinions and estimates constitute our judgment as of the date of this material and are subject to change without notice. Past performance is not indicative of future results. This communication is not intended as an offer or solicitation for the purchase or sale of any financial instrument. Benzinga does not provide individually tailored investment advice. Any opinions and recommendations herein do not take into account individual client circumstances, objectives, or needs and are not intended as recommendations of particular securities, financial instruments or strategies to particular clients. You must make your own independent decisions regarding any securities, financial instruments or strategies mentioned or related to the information herein. Periodic updates may be provided on companies, issuers or industries based on specific developments or announcements, market conditions or any other publicly available information. However, Benzinga may be restricted from updating information contained in this communication for regulatory or other reasons. Clients should contact analysts and execute transactions through a Benzinga subsidiary or affiliate in their home jurisdiction unless governing law permits otherwise.
This communication may not be redistributed or retransmitted, in whole or in part, or in any form or manner, without the express written consent of Benzinga. Any unauthorized use or disclosure is prohibited. Receipt and review of this information constitutes your agreement not to redistribute or retransmit the contents and information contained in this communication without first obtaining express permission from an authorized officer of Benzinga. Copyright 2022 Benzinga. All rights reserved.
Login to comment