The small-cap benchmark Russell 2000 has made a move that rewrites the map for small-cap sentiment just weeks after the index breached correction territory in March.
The iShares Russell 2000 ETF (NYSE:IWM) is up 11.7% month-to-date through April 20, its strongest monthly performance since December 2023. Notably, it has closed higher in 12 of 13 sessions this month.
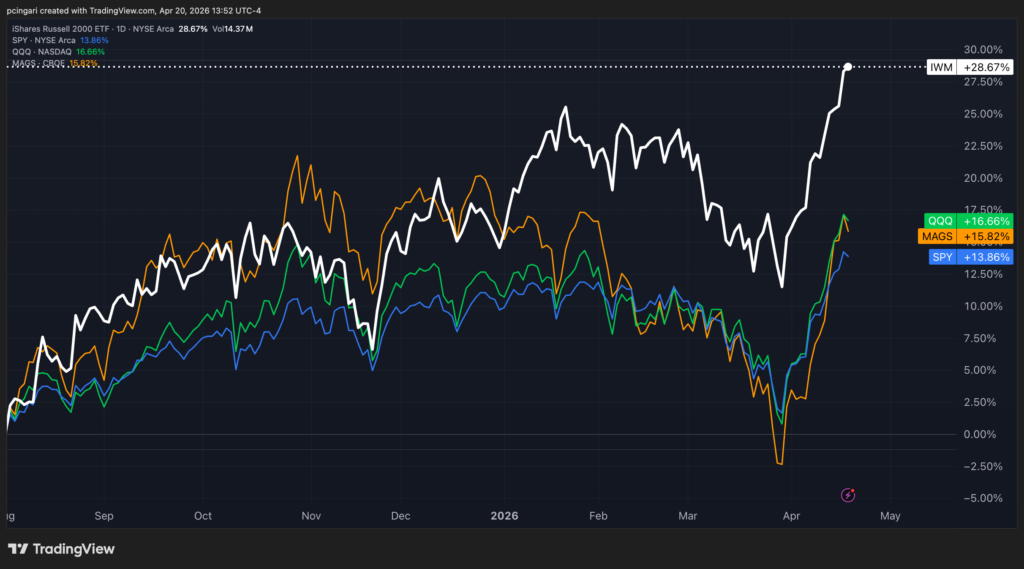
The snapback has pulled IWM back toward its record highs, fueled by a ceasefire-led collapse in oil and a reset in Federal Reserve rate expectations.
Benzinga asked a narrower question: what happens to small caps in the months after a 10%+ monthly surge?
‘The Giant Killer Is Back’
John Roque, head of technical research at 22V Research, has been making the small-cap bull case since the summer.
In his latest chart packet titled “The Giant Killer,” he compared the Russell 2000 to Danny Padilla, the 5’2″ 170-pound bodybuilder who beat Arnold Schwarzenegger at the 1975 IFBB Mr. USA.
The framing held up through the March selloff and now looks prescient.
The technical picture reinforces it. Roque’s April 20 update shows the Russell 2000 cash index at 2,775 after a breakout from a multi-year base around 2,000. His target is 3,200 — another 15% higher from current levels.
Since August 2025, the Russell 2000 has been up 28%. Over the same stretch, the S&P 500 – tracked by the SPDR S&P 500 ETF Trust (NYSE:SPY) – is up 14%, the Nasdaq 100 – tracked via the Invesco QQQ Trust (NYSE:QQQ) – is up 16%, and the Roundhill Magnificent Seven ETF (NYSE:MAGS) 15%.
Chart: Small Caps Have Outperformed Tech-Heavy Benchmarks Since August 2025
The Russell 2000 Signal: 13 Episodes Since 1987
Since the iShares Russell 2000 ETF launched in 1987, monthly rallies of 10% or more have occurred exactly 13 times before this one.
The sample spans recessions, recoveries, bubbles and crises — from the 2003 dot-com bottom to the 2020 Covid low to the 2024 post-election surge.
The one-month average sits at just 1.71%, with a win rate barely above a coin flip. Buying the first move rarely pays off fast.
At three months, the hit rate climbs to 69% and the average return more than triples.
At 12 months, the average jumps to 17.6%, the median to 10.09%, and the Sharpe ratio — a measure of return per unit of volatility — reaches 0.80.
| Date | Context | IWM Move % | Forward return (%) 1M | Forward return (%) 3M | Forward return (%) 6M | Forward return (%) 12M |
|---|---|---|---|---|---|---|
| Apr 2003 | Dot-com bottom | +10.28 | +10.87 | +19.24 | +32.87 | +39.94 |
| Apr 2009 | GFC low | +15.39 | +3.40 | +14.53 | +16.10 | +47.67 |
| Sep 2010 | QE2 anticipation | +12.16 | +4.15 | +15.91 | +24.70 | −4.74 |
| Oct 2011 | Euro crisis bounce | +15.10 | −0.35 | +6.77 | +2.84 | +10.90 |
| Nov 2016 | Trump 1.0 victory | +11.06 | +2.46 | +4.73 | +3.58 | +16.75 |
| Jan 2019 | Powell pivot | +11.32 | +2.70 | −2.15 | −0.15 | +7.69 |
| Apr 2020 | Covid trough | +13.85 | +6.59 | +13.08 | +17.48 | +72.58 |
| Nov 2020 | Vaccine news | +18.24 | +13.56 | +22.05 | +24.57 | +22.89 |
| Jul 2022 | Bear rally | +10.56 | −2.00 | −2.09 | +2.26 | +6.12 |
| Oct 2022 | Pre-CPI relief | +11.16 | −4.89 | +4.45 | −4.43 | −2.00 |
| Dec 2023 | Fed pivot rally | +11.72 | −3.90 | +4.78 | +1.09 | +10.09 |
| Jul 2024 | Rotation trade | +10.34 | −1.69 | −2.72 | +1.17 | −2.00 |
| Nov 2024 | Trump 2.0 victory | +11.07 | −8.65 | −11.25 | −15.21 | +2.84 |
| Apr 2026 | Hormuz recovery | +11.54 (Through April 20) | — | — | — | — |
| Average | — | +1.71 | +6.72 | +8.22 | +17.60 | |
| Median | — | +2.46 | +4.78 | +2.84 | +10.09 | |
| Win rate | — | 53.85% | 69.23% | 76.92% | 76.92% | |
| Sharpe | — | 0.28 | 0.71 | 0.62 | 0.80 | |
| Max drawdown | — | −8.65 | −11.25 | −19.44 | −19.44 |
The Best Cases: Cycle Bottoms
April 2020 — Covid Trough. The Russell 2000 surged 13.85% as the Fed unleashed unlimited QE and brought interest rates to the zero-lower bound. Twelve months later the ETF was up 72.58%, the single best outcome in the dataset.
April 2009 — GFC Low. Small caps jumped 15.39% as credit markets thawed and the bank stress-test results removed tail risk. The next 12 months delivered 47.67%.
April 2003 — Dot-Com Bottom. A 10.28% monthly gain came as the market absorbed the Iraq invasion and began pricing the end of the tech bust. Twelve-month forward return: 39.94%.
The Worst Cases: Mid-Cycle And Late-Cycle Traps
November 2024: Post-Election Euphoria. The Russell 2000 popped 11.07% on the Donald Trump election-victory trade, as investors priced in deregulation and tax cuts. What followed was an 8.65% drop in the next month, a 15.21% fall over six months, and a modest 2.84% gain over 12 months.
October 2022: Bear Market Rally. An 11.16% surge gave way to a 2% decline over 12 months as the Fed kept hiking rates amid a slowing economy.
September 2010: QE2 Anticipation. A 12.16% rally on Fed easing hopes preceded a 4.74% loss 12 months later as the Eurozone debt crisis metastasized.
The bad outcomes cluster around one theme: rallies that came on policy speculation rather than policy confirmation.
Where April 2026 Fits In Russell 2000 History
The current setup has one feature of the good cases — a preceding correction — and one feature of the bad cases — monetary policy not yet confirmed.
The Russell 2000 fell 10.9% from the January peak before this rally, qualifying as a reset.
However, expectations on interest-rate cuts have shifted following the start of the conflict in Iran. While prior to the war, traders had priced in at least two rate cuts for 2026, prediction platform Polymarket now shows zero cuts as the leading outcome at 35%, with one cut at 31%.
That is a material shift from pre-war positioning.
What It Means For Investors
The message from 39 years of data is narrow but clear. Buying the Russell 2000 the day after a 10%+ month offers a near coin-flip outcome over the next four weeks.
The payoff compounds in the second half of the year, when the win rate hits 77% and the average return reaches double digits.
The edge is not in the signal itself. It is in the context.
A 10% month coming out of a correction, with policy easing ahead, has been one of the most reliable setups small-cap investors have ever seen. A 10% month on speculation, with policy uncertain, has been a trap.
April 2026 sits on the line between those two histories. The next Fed meeting, the next inflation print, and the status of the Strait of Hormuz will decide which one it rhymes with.
Photo: Shutterstock
Login to comment