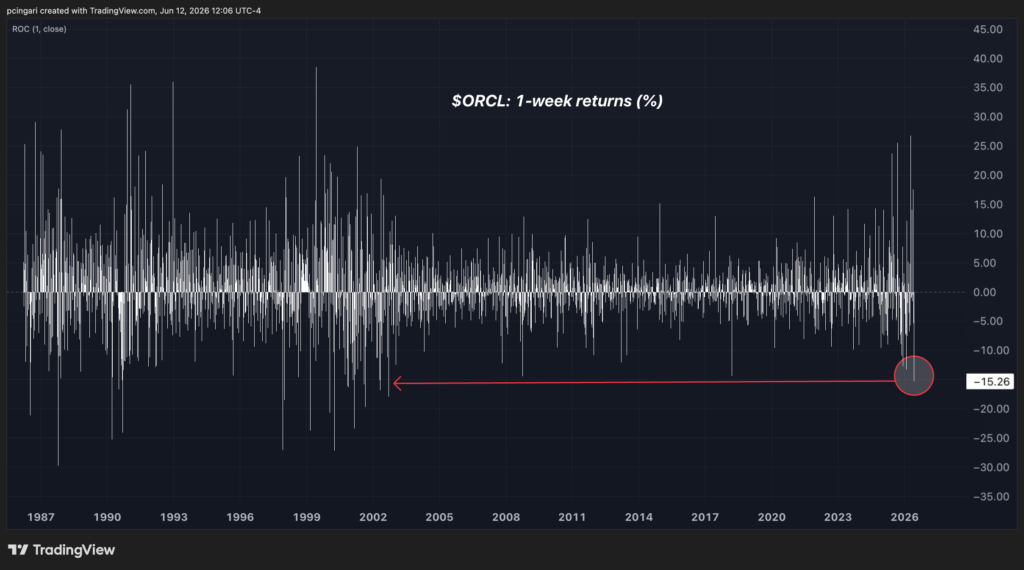
Oracle Corp. (NYSE:ORCL) is on pace for its worst week since September 2002, with shares down roughly 15% for the week.
The weekly drawdown ranks among the most severe in Oracle’s history as a public company — even though its fiscal fourth-quarter results, reported June 10, beat Wall Street on both the top and bottom lines.
Why Did Oracle Plunge This Week?
Oracle’s revenue rose 20.6% year-over-year to $19.18 billion, edging the Street, while non-GAAP EPS of $2.11 topped the $1.97 consensus and operating margin of 44.8% beat.
The problem was the price of that growth as investors recoil from the cloud giant’s ballooning capital spending and the cash-flow strain behind its artificial intelligence buildout.
Fiscal 2026 capex hit $55.7 billion, above the guided $50 billion, and Oracle posted $23.7 billion in negative free cash flow.
For fiscal 2027, it guided capex to $90–95 billion — about $70 billion net of customer prepayments — and plans to raise roughly $40 billion in debt and equity, including a $20 billion share sale.
Chart: Oracle On Pace For Worst Weekly Performance Since September 2002
Wall Street Stays Bullish
The sell-side is largely treating the drop as noise.
Bank of America Corp.’s analyst Tal Liani reiterated a Buy and $240 target, calling the Software and SaaS softness noise relative to the infrastructure ramp — citing 93% growth in cloud IaaS/PaaS revenue and an $85 billion sequential jump in RPO. IaaS now makes up 58% of cloud revenue, up from 44% a year ago.
Goldman Sachs’ Gabriela Borges raised her target from $228 to $239, keeping a Buy.
She tied the selloff to a “slimmer beat” and higher headline capex, but argued the funding is better than the optics: prepayments and bring-your-own-cloud deals cut net cash outlay to about $70 billion.
Oracle’s Remaining Performance Obligations — the contracted backlog of future revenue — exploded 363% year-over-year to $638 billion.
What History Says About ORCL 15% Weekly Crashes
Since its 1986 IPO, Oracle has fallen 15%+ in a single week only 20 times — and the forward returns are no clean “buy the dip.”
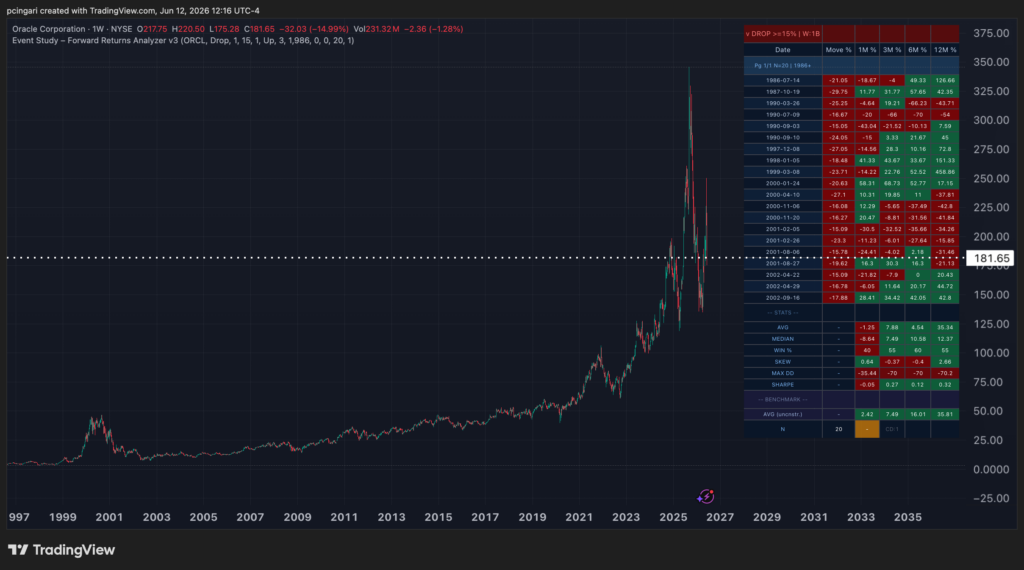
| Window | Average | Median | Win rate |
|---|---|---|---|
| 1 month | -1.3% | -8.6% | 40% |
| 3 months | +7.9% | +7.5% | 55% |
| 6 months | +4.5% | +10.6% | 60% |
| 12 months | +35.3% | +12.4% | 55% |
Near-term, the bleeding tends to continue: a month later, ORCL was higher just 40% of the time. Twelve months out it was higher 55% of the time — 11 of 20 instances — and lower the other nine.
But the averages flatter the trade. The 35.3% one-year average growth roughly matches Oracle’s unconditional 35.8% return over the same span, meaning these crashes handed buyers no edge over simply owning the stock.
The gap between that average and the 12.4% median is the tell: the mean is inflated by one outlier, the March 1999 week that preceded a 459% dot-com surge.
The worst case was July 1990, followed by a 54% one-year loss.
And of the nine episodes that ended lower a year later, seven cluster in the 2000–2001 dot-com bust, the other two in the early-1990s recession.
The bottom line: analysts see a temporary repricing of an accelerating infrastructure story; the tape sees a company burning cash to chase an AI boom it no longer wants to fund.
History says the month after a crash like this has more often hurt than helped — and the big one-year gains needed a roaring bull cycle to deliver.
Image: Shutterstock
Login to comment