Gold prices have slumped into a bear market this year, even as geopolitical risks rose. The metal has fallen by over 27% from its January high, underperforming the stock market. This retreat is likely due to falling ETF inflows and rising bond yields.
Gold ETF Inflows and Rising Bond Yields
Demand for gold among American investors has waned this year as many of them have rotated to the memory sector.
Data shows that the popular SPDR Gold Shares ETF (NYSE:GLD) has had over $1.63 billion in outflows in the last 30 days and $7.4 billion in the last three months. Its six-month outflows have jumped to over $12.2 billion.
The same trend has happened among other popular gold ETFs. The iShares Gold Trust (NYSE:IAU) has suffered $1.2 billion in outflows in the last 30 days and $4.5 billion in the last 6 months.
Similarly, the SPDR Gold Minishares Trust (NYSE:GLDM) has had over $75.5 million in outflows. In contrast, the recently launched Roundhill Memory ETF (CBOE: DRAM) has accumulated over $23 billion in assets as demand for companies like Micron and Sandisk jumped.
In theory, gold should do well now that geopolitical tensions are rising, with the US and Iran war escalating. Ukraine and Russia have continued fighting, while Donald Trump has intensified his trade war.
These events have led to higher crude oil prices, with Brent retesting the resistance level of $100 for the first time in over a month. As a result, investors are anticipating inflation to rise, with odds that the Federal Reserve hiking interest rates rising. These odds have jumped to 73% on Polymarket.
US government bond yields have jumped in the past few months. The two-year yield jumped to 4.33%, while the ten-year moved to 4.70%. As a result, gold is now competing with higher-yielding bonds.
Gold Price is Showing Bottoming Signs
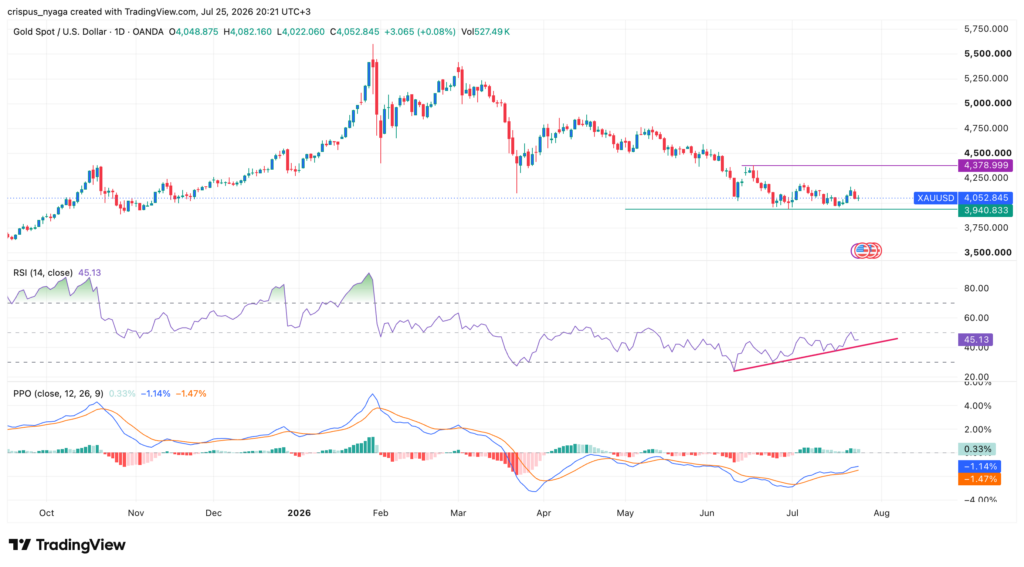
On the positive side, there are signs that gold is showing some bottoming signs. It has formed a double-bottom pattern at $3,940.
At the same time, there are signs that oscillators like the Relative Strength Index and the Percentage Price Oscillator are forming a bullish divergence pattern. The RSI has been in an upward trend and is nearing the psychological level of 50. Also, the two lines of the PPO have been rising and is nearing the zero line.
Therefore, there is a possibility that gold will bounce back, potentially to the key resistance level of $4,378, its highest point on June 18.
Image: Shutterstock
Login to comment