Simon Property Group (NYSE:SPG) stock has performed well this year, rising 20% since January, supported by stable revenue and profit growth despite concerns about the retail sector amid elevated inflation and interest rates. SPG has outperformed both the S&P 500 Index and the Vanguard Real Estate ETF (NYSE:VNQ), which has risen 12% over the same period.
Simon Property Group In Focus Ahead of Earnings
SPG is the fourth-biggest company in the REIT industry in the United States. It is a top operator of malls that house some of the top retailers in the US, like The Gap, Foot Locker, Signet Jewellers, and Tommy Hilfiger.
The company will be in the spotlight on Monday when it publishes its financial results, which will provide more color about its business. Its last earnings showed that its business did well, with its net income attributable to shareholders rising to $479 million from $413 million in the first quarter in the same period last year.
Most notably, its funds from operations (FFO), the most important profit metric for REITs, jumped to $1.2 billion from $1.11 billion in the same quarter a year earlier. Most notably, its occupancy rose slightly to 96% from the previous 95.9%, even as the base minimum rent per square foot increased to $61.99.
Analysts are optimistic that Simon’s growth continued in the second quarter, with the estimated FFO per share rising to $3.21 and revenue hitting $1.61 billion. If this is correct, the company may decide to boost its dividend again as it did in the last result.
The main challenge, however, is that Simon’s valuation remains elevated and is much higher than that of other fast-growing technology companies. For example, it has a forward price-to-earnings ratio of 34, higher than the real estate sector’s 31.7. This multiple is much higher than that of Nvidia (NASDAQ:NVDA), a technology company growing by over 80% annually.
SPG Stock Has Formed a Series of Higher Highs and Higher Lows
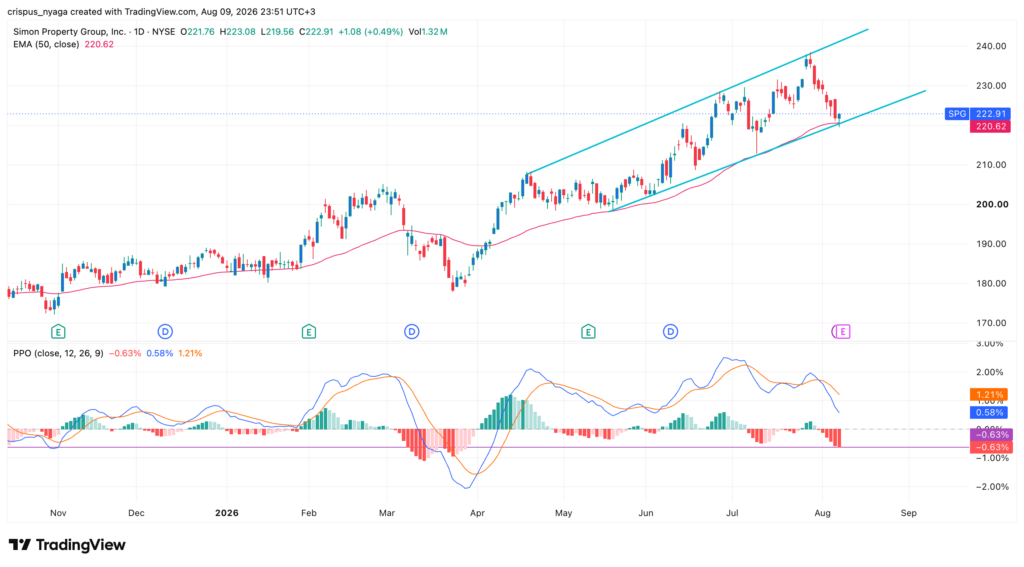
Simon Property Group stock chart | Source: TradingView
Technicals suggest that the Simon Property Group stock has been forming a series of higher highs and higher lows since April 26 this year. It recently retested the lower side of the ascending channel and formed a small hammer candlestick pattern.
The stock has also bottomed at the 50-day moving average, while the histogram of the Percentage Price Oscillator (PPO) has dropped to the lowest point since March. These technicals suggest that the stock will rebound, potentially to the upper side of the channel at $240. A drop below the lower side of the channel will point to more downside.
Image: Shutterstock
Login to comment