Earnings Narrative
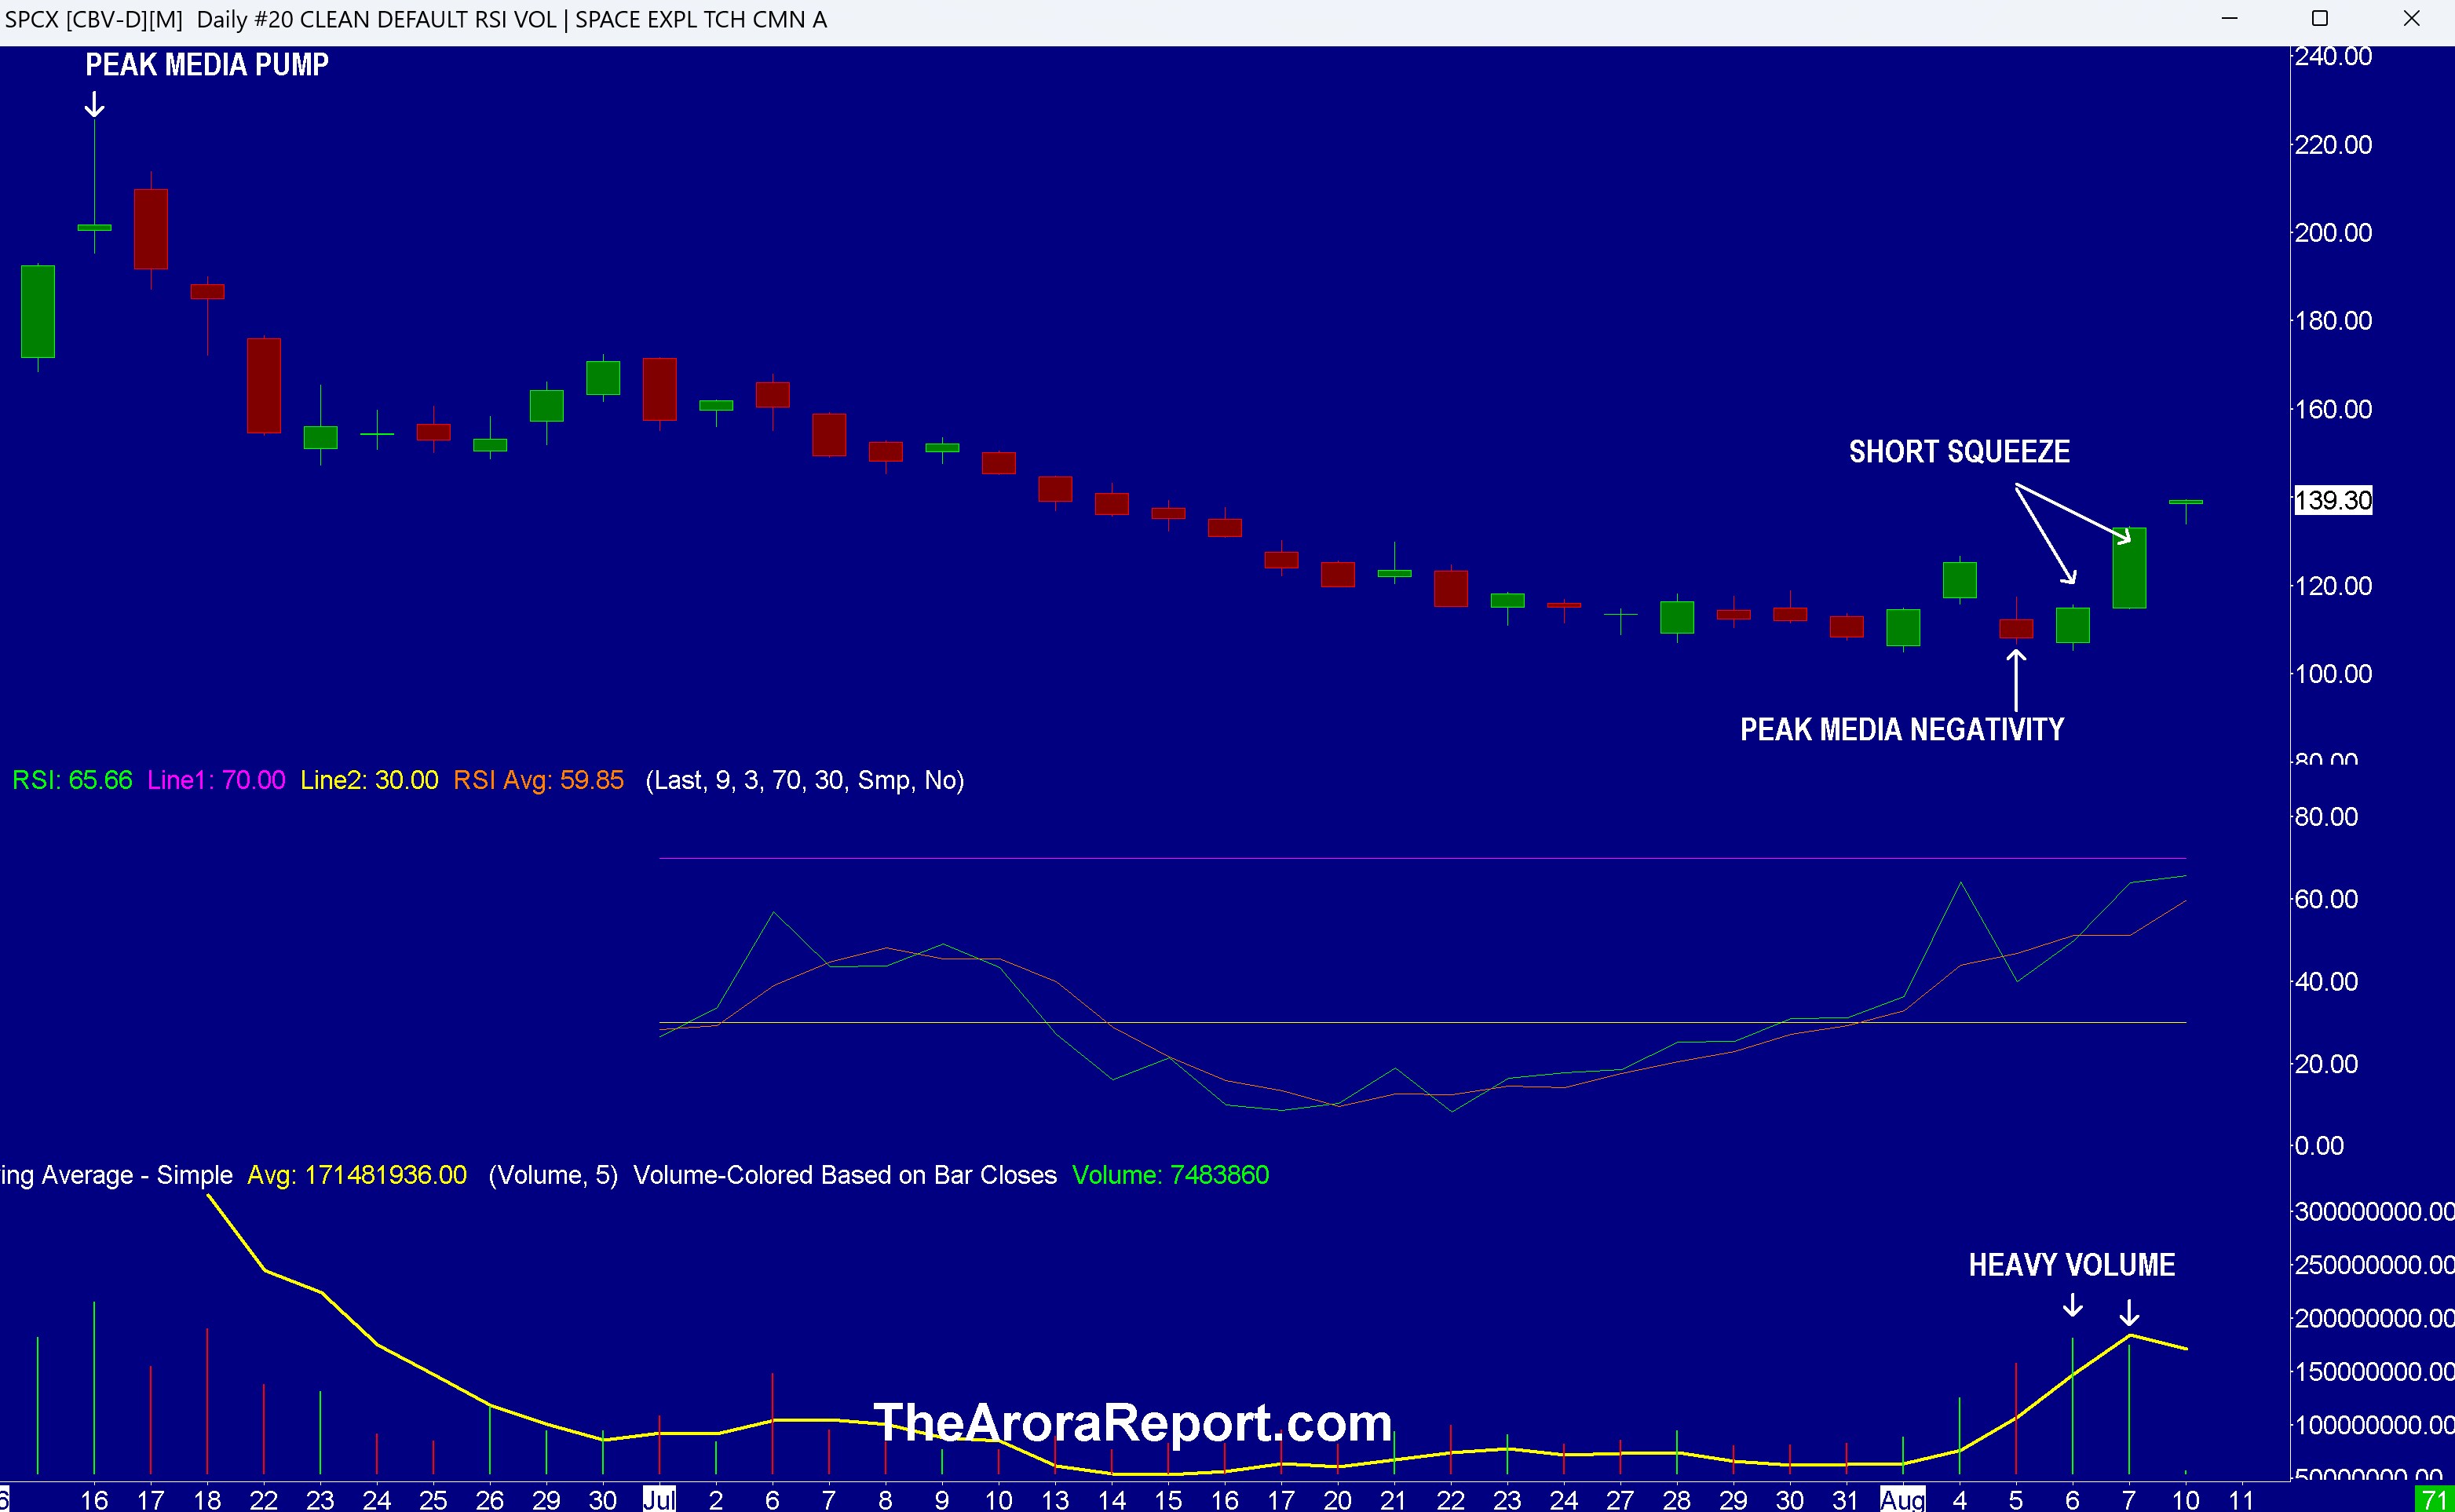
Please click here for an enlarged chart of Space Exploration Technologies Corp (NASDAQ:SPCX).
Note the following:
- This article is about the big picture, not an individual stock. The chart of SPCX stock is being used to illustrate the point.
- SPCX stock is important because it is creating positive speculative sentiment as of this writing.
- The chart shows that when the media frenzy was at its peak to pump SPCX stock, SPCX stock topped out.
- The chart shows that when media frenzy reached peak negativity, SPCX stock bottomed out.
- Newer investors should pay special attention to the foregoing. In SPCX, a large number of bag holders have been created who went all in on the peak media pump and took huge losses by selling on the peak media negativity.
- The chart shows a rally in SPCX stock as media negativity peaked around the lock-up expiration.
- On June 22, we wrote:
There is a fair probability that on August 6, SPCX stock could rally if a short squeeze starts, instead of falling big time as the media is predicting.
- The chart shows heavy volume on short squeeze.
- In the middle of the uber bullishness right now, prudent investors need to be very careful because the earnings narrative driving the uber bullishness may be too optimistic. The S&P 500 (SPX), as represented by SPY, has broken out on this earnings narrative. Here are the details:
- The headline: S&P 500 earnings growth for Q2 is about 50%
- Analyst consensus going into the quarter: about 23%
- The headline number is heavily distorted by extraordinary investment-related gains at Alphabet Inc Class A (NASDAQ:GOOGL), Alphabet Inc Class C (NASDAQ:GOOG) and Amazon.com, Inc. (NASDAQ:AMZN).
- Alphabet reported about a $98 billion investment-related gain.
- Amazon reported about $53 billion of other income, primarily related to investments including Anthropic.
- These are not recurring operating earnings.
- After taking out the Alphabet and Amazon distortion, earnings growth falls to roughly 31% – 32%. This is still very strong, but nowhere near the 50% headline.
- This is a semiconductor supercycle. The open question is how long it will last.
- Semiconductor and semiconductor-equipment earnings are growing about 135%
- Strip out both the Alphabet and Amazon distortion and the semiconductor surge from headline earnings growth, and the underlying S&P 500 earnings growth is roughly 22% – 23%. This is still excellent, but less than half the headline number.
- Consumer Price Index (CPI) will be released on Wednesday and has the potential to move the markets.
- President Trump is shifting from threatening attacks on Iran to using economic pressure as the main tool.
- Oil is taking President Trump’s shift as an admission that Iran has the upper hand. For this reason, oil prices are rising. For the time being, the momo crowd is oblivious. However, if oil prices continue to rise, it will be negative for the stock market.
Magnificent Seven Money Flows
Most portfolios are now heavily concentrated in the Mag 7 stocks. For this reason, it is important to pay attention to early money flows in the Mag 7 stocks on a daily basis.
In the early trade, money flows are positive in Apple Inc (NASDAQ:AAPL), Amazon.com, Inc. (NASDAQ:AMZN), Meta Platforms Inc (NASDAQ:META), Microsoft Corp (NASDAQ:MSFT), NVIDIA Corp (NASDAQ:NVDA), and Tesla Inc (NASDAQ:TSLA).
In the early trade, money flows are negative in Alphabet (GOOG).
In the early trade, money flows are negative in SPDR S&P 500 ETF Trust (NYSE:SPY) and Invesco QQQ Trust Series 1 (NASDAQ:QQQ).
Momo Crowd And Smart Money In Stocks
Investors can gain an edge by knowing money flows in SPY and QQQ. Investors can get a bigger edge by knowing when smart money is buying stocks, gold, and oil. The most popular ETF for gold is SPDR Gold Trust (GLD). The most popular ETF for silver is iShares Silver Trust (SLV). The most popular ETF for oil is United States Oil ETF (NYSE:USO).
Bitcoin
Bitcoin (CRYPTO:BTC) is seeing selling.
What To Do Now
Consider continuing to hold good, very long term, existing positions and add tactical positions based on signals.
**
The Arora Report is known for its accurate calls. The Arora Report correctly called the big artificial intelligence rally before anyone else, the new bull market of 2023, the bear market of 2022, new stock market highs right after the virus low in 2020, the virus drop in 2020, the DJIA rally to 30,000 when it was trading at 16,000, the start of a mega bull market in 2009, and the financial crash of 2008. Please click here to sign up for a free forever Generate Wealth Newsletter.
Editorial note: The performance claims and descriptions of past market calls above are provided by the author and have not been independently verified by Benzinga. Past performance or successful market calls are not indicative of future results. Readers should conduct their own research before making investment decisions.
Benzinga Disclaimer: This article is from an unpaid external contributor. It does not represent Benzinga’s reporting and has not been edited for content or accuracy.
Login to comment