Most stocks move less on earnings than options say they will. Since late 2021, fewer than half of all earnings events — 42% — saw the stock move past the number options had priced in. Options usually charge a bit too much for earnings night.
But when a stock rips far through its expected move, the next quarter doesn’t get priced like the last one.
Data compiled by EarningsWatcher across more than 22,000 earnings events on roughly 2,000 stocks with listed options shows the repricing is proportional to the surprise: move at least three times what options priced, and the next quarter’s expected move gets raised by a median 34% — in four cases out of five. Sometimes that markup turns out right, and sometimes it doesn’t. The odds differ sharply depending on how aggressively the market repriced the stock.
One Loud Quarter Reprices The Next
Normally, a stock’s expected move barely changes from one quarter to the next — the median drift is about one percent.
An earnings shock breaks that calm, and the repricing follows a clean staircase. Miss badly — move less than half of what options priced; call it a dud — and the next expected move gets cut by about 7%. Beat modestly, and it gets a nudge. Beat by two to three times, +14%. Beat by three times or more, +34% — and that new number is often the highest expected move the stock has carried in a year.
The re-rating sticks, too: after a 2x-plus shock, the expected move is typically about 16% higher than its pre-shock level — and remains about 16% above that level two quarters later. Call it IV memory, a sibling of the IV rush and IV crush: the market carries the last earnings shock into the price of the next one.
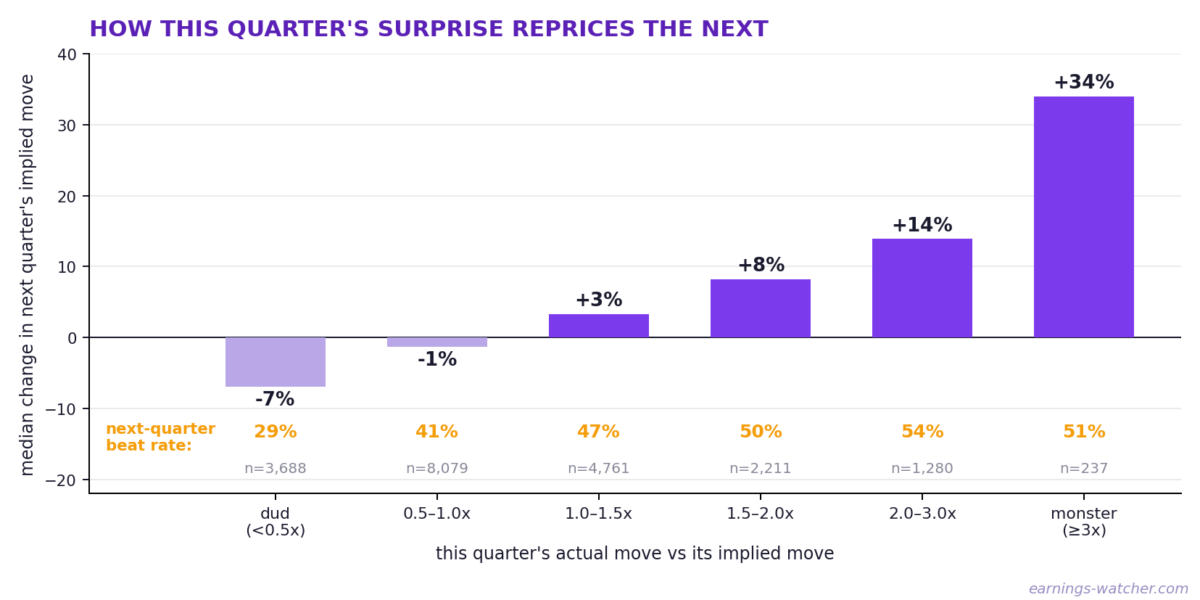
Median change in the next quarter’s implied move, by the size of this quarter’s surprise, across 20,256 consecutive-quarter event pairs. Beneath each bar: how often the stock then beat that repriced implied move. Source: EarningsWatcher research
And The New Price Is Usually About Right
Start from the baseline: in any given quarter, only 42% of earnings events see the stock beat its expected move. In this analysis, a shock means the stock reached at least 1.5 times the move options had priced. After a shock, the beat rate jumps to 51% — even though the bar itself was just raised. After a dud, it falls to 29%.
Loud stocks tend to stay loud, quiet stocks tend to stay quiet, and the market’s markups track that closely: the typical shocked stock delivers almost exactly its new number. And this isn’t a quirk of one corner of the market — in every sector with a meaningful sample, from software to energy to real estate, stocks beat their expected move more often after a shock than that sector normally does.
A real case shows how it works. Ford (NYSE:F), July 2024: options priced a 7% move, and the stock moved as much as 18.4%. Next quarter, the market didn’t price another 18% — it priced 8.7%. The stock reached 10.5%: far below the original shock, and much closer to the new bar. The market isn’t predicting another explosion. It’s admitting the stock’s baseline changed.
The Repricing Is The Tell
Now the sharpest finding. Not every shock gets the same treatment. Across 3,728 shock events, the market chased about a quarter, raising the next expected move by 25% or more. It shrugged at a third, leaving the number roughly where it was. The rest fell in between — and so did their results: the harder the repricing, the lower the beat rate.
The chased group disappointed: only 45% cleared their new, expensive bar. Engineering and construction company Fluor (NYSE:FLR) is the textbook case. Its expected move had sat near 11% for three reports running, and the stock had moved in line with it. Then on its August 2025 report it fell as much as 33.7%, against a 10.9% expected move. The market raised the next quarter’s bar to 15.3% — the highest in over a year. The stock moved 4.1%.
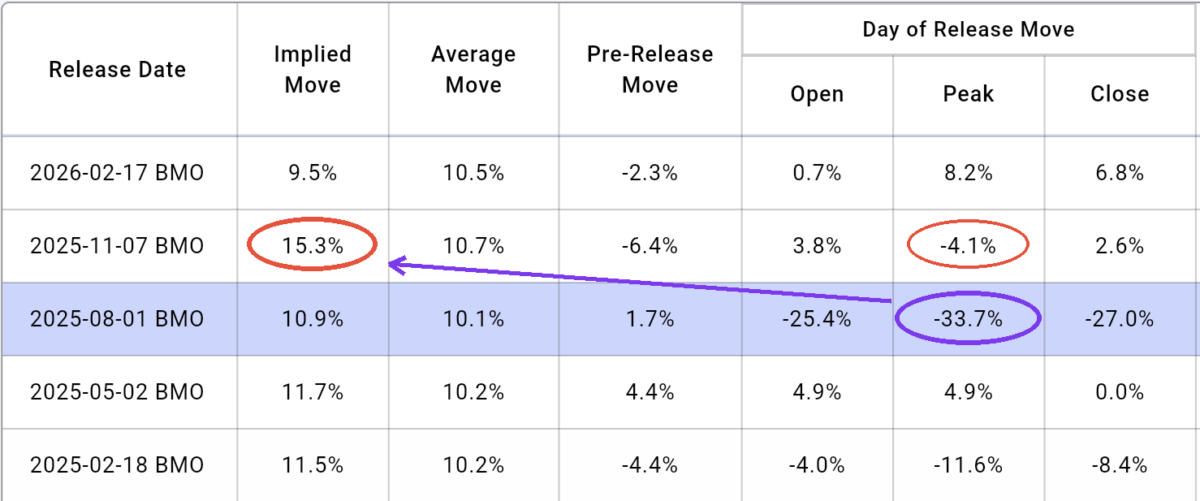
Fluor’s earnings history on the EarningsWatcher platform. Circled in purple: the August 2025 shock — down as much as 33.7% against a 10.9% expected move. The arrow follows the market’s reaction: a 15.3% bar for the next quarter, the highest in over a year — answered by a 4.1% move. Source: EarningsWatcher
The shrugged group kept delivering: 56% beat their expected move again. Roblox Corporation (NYSE:RBLX) moved 24.4% against a 14.7% expected move in April 2026; the market lowered the next quarter’s bar to 13%; the stock moved as much as 30.4%.
And the weakest follow-through in the whole analysis comes from combining a miss with a markup: stocks that fell short of their expected move but had the next one raised anyway cleared it just 17% of the time. GameStop (NYSE:GME) in September 2023: the stock moved 6.1% against a 14.2% expected move — a clear dud — yet options priced a 21.4% move for the next quarter. It reached just 11.3%. Drama kept being priced into a stock that had stopped delivering it.
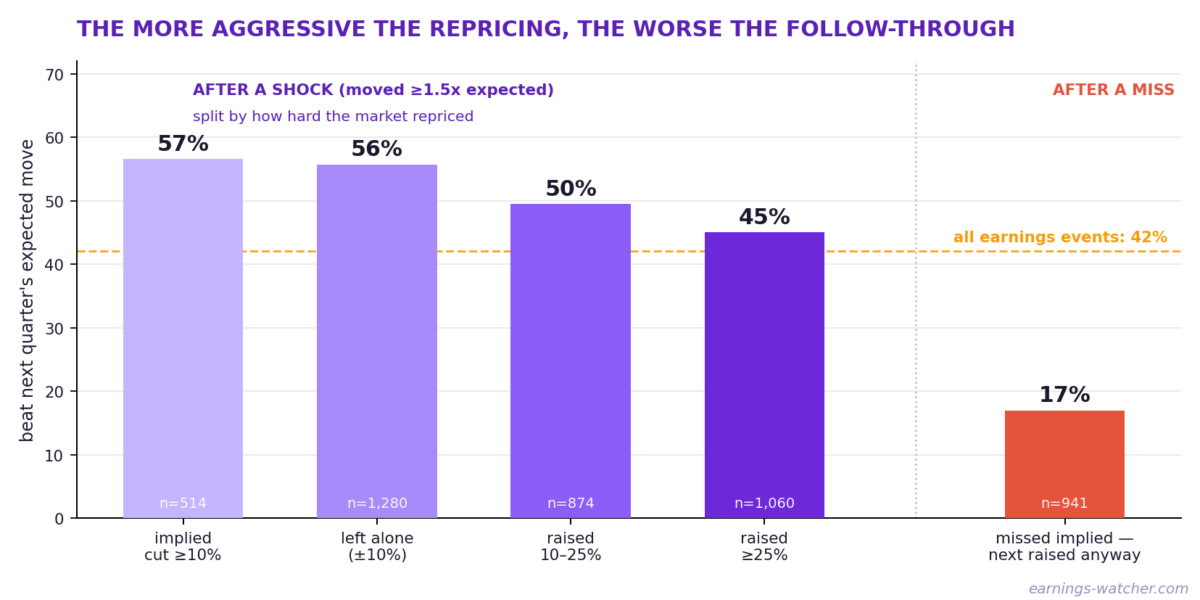
Next-quarter beat rates after a shock, split by how hard the market repriced the stock — and, at right, after a miss that got repriced upward anyway. Source: EarningsWatcher research
Put simply: after a big markup, stocks tended to move a bit less than their new expected move — the markup was too big. After a shrug, a bit more — the number was left too cheap. Across more than a thousand cases on each side, the lean is clear.
The Bottom Line
By the time the next earnings report arrives, the options market has rendered its verdict on the previous shock: the new expected move. On average, that verdict is close to fair — and where it isn’t, the errors follow a pattern: the market’s second guess is more informative than its first mistake. Two questions decide how much to trust the new number.
First: did the stock beat its expected move, or miss it? Surprises carry over — loud stocks tend to stay loud. Second: how hard did the market reprice? The largest markups tended to overshoot the move that followed, while shrugs tended to undershoot it — and a markup after a miss was the least reliable number of all.
The expected move is just a number until you put it next to the stock’s own history. Then it becomes an opinion you can grade.
About the data: 22,268 earnings events across 2,010 stocks with listed options (stocks under $5 excluded), each with at least eight consecutive quarterly reports, October 2021 through June 2026, with outcomes through August 2026. The implied (expected) move comes from the at-the-money straddle in the nearest expiration after each report, priced at the last close before it; events without usable quotes are excluded. The actual move is the reaction session’s peak move from that close — EarningsWatcher’s standard convention. Ratios are medians; beat rates are the share of events beating the implied move. Measured close-to-close instead, every finding points the same way, at harsher levels. Beating the implied move describes the size of the move, not the profitability of any options position. The window spans one bear year and a long bull run; these are historical tendencies, not predictions for any single report.
Disclosure: The author operates EarningsWatcher, the analytics platform whose data is referenced in this article. The author holds no positions in the securities mentioned.
Disclaimer: EarningsWatcher is a publisher, not a registered broker-dealer or investment advisor. The information in this article is for informational and educational purposes only and should not be considered personalized investment advice.
Benzinga Disclaimer: This article is from an unpaid external contributor. It does not represent Benzinga’s reporting and has not been edited for content or accuracy.
Login to comment