Hidden Weakness
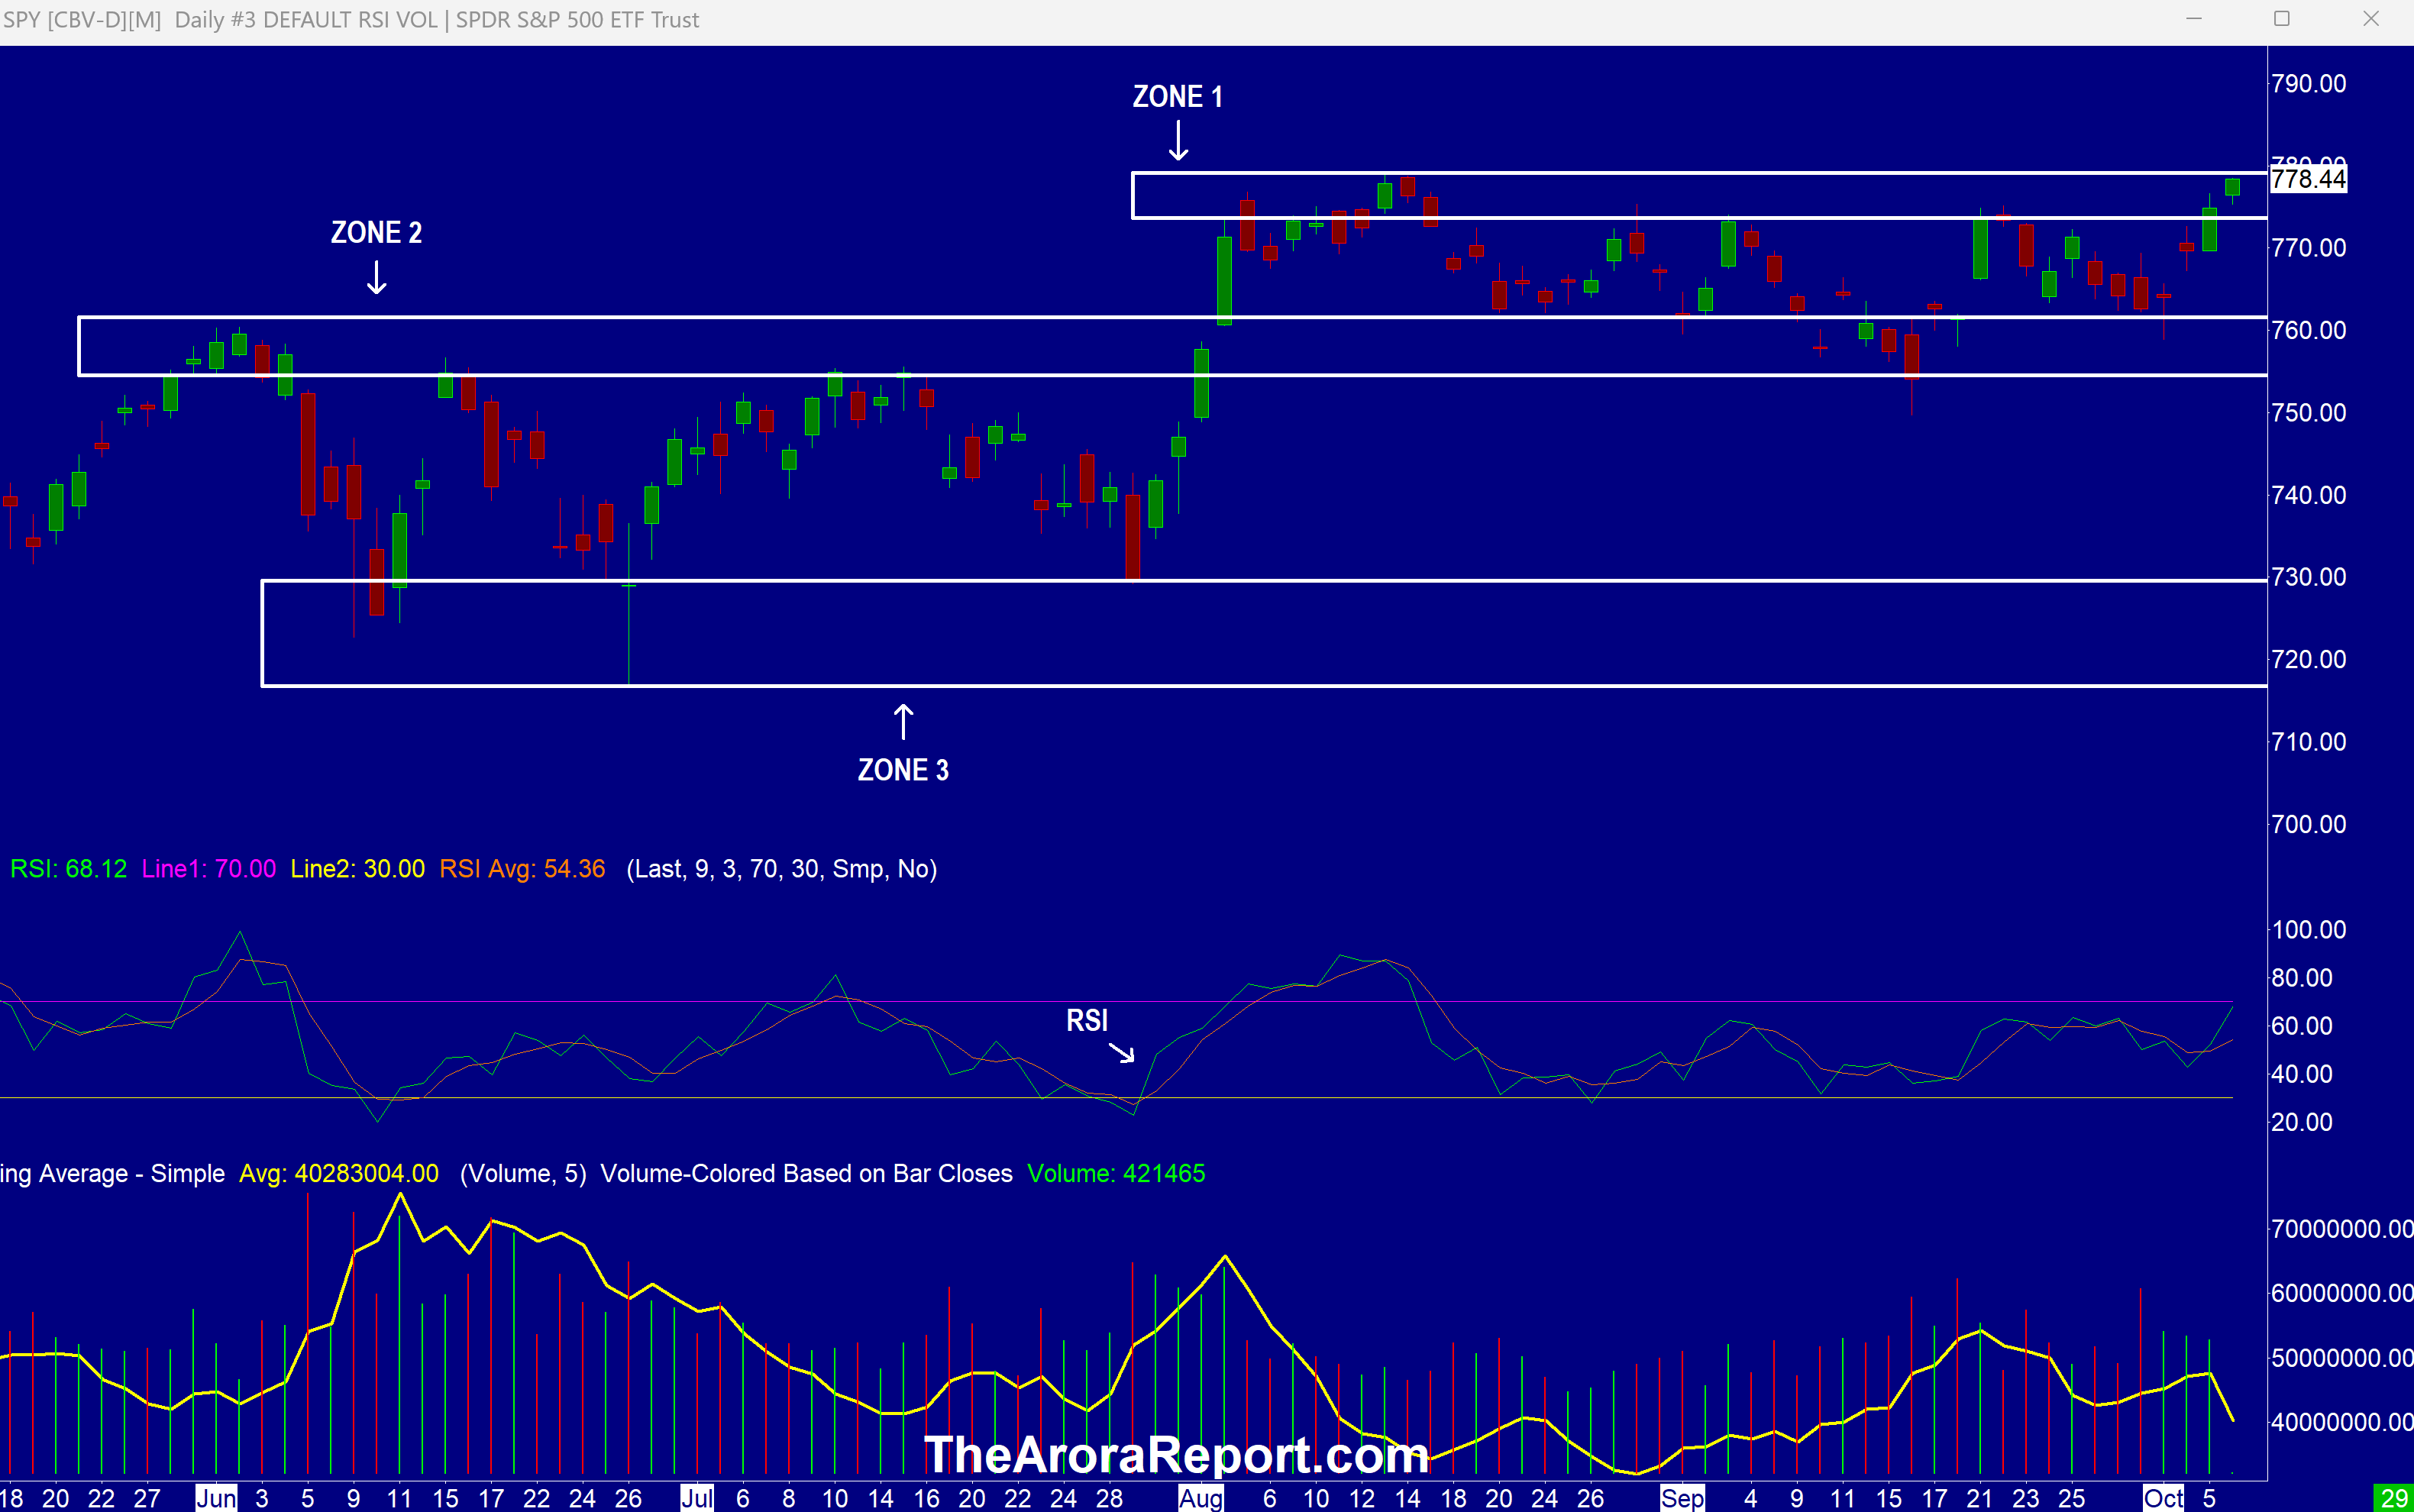
Please click here for an enlarged chart of SPDR S&P 500 ETF Trust (NYSE:SPY) which represents the benchmark stock market index S&P 500 (SPX).
Note the following:
- The chart shows the stock market is nearing a record high.
- The chart shows a sustained new high would push the stock market above zone 1 (resistance).
- RSI on the chart shows the stock market is neither overbought nor oversold. The RSI pattern indicates there is room for the market run.
- In our analysis, in the middle of all of the bullishness, prudent investors should not ignore the concentration risk. Roughly 40% of S&P 500 is concentrated in the top 10 stocks. Historically, concentration does not end well. The prevailing wisdom is that this time is different. Investors said the same thing in 1973 and 2000 before significant market drops. In the 1973 – 1974 bear market, S&P 500 fell 48.2%. In the 2000 – 2002 dot com crash, S&P 500 fell 49.2% and Nasdaq Composite fell about 78%.
- Further in our analysis, prudent investors should also not ignore the hidden weakness below the surface.
- S&P 500 is up 13.6% year to date. However, the top 10 stocks and semiconductors are driving much of the gain. When the top 10 stocks and semiconductors are excluded, the rest of S&P 500 has gained only 5.2%.
- About 38% of S&P 500 stocks are down more than 20% from their 52 week highs. About 50% of Russell 3000 stocks are in a bear market.
- Four additional factors are adding to the bullishness in the stock market this morning:
- Oil is pulling back. This is primarily for two reasons:
- There are reports that more tankers are traveling through the Strait of Hormuz with their lights and radios off.
- The E.U. is releasing 100M barrels of diesel and oil.
- Yields are pulling back. Yields are pulling back due to oil pulling back.
- Advanced Micro Devices Inc (NASDAQ:AMD) is planning to increase chip supply in 2027 to meet growing demand.
- Alphabet Inc Class A (NASDAQ:GOOGL) and Constellation Energy Corp (NASDAQ:CEG) have announced a plan to bring 890 MW of nuclear power to the grid. Constellation Energy is the largest operator of nuclear plants in the U.S.
- Oil is pulling back. This is primarily for two reasons:
Magnificent Seven Money Flows
Most portfolios are now heavily concentrated in the Mag 7 stocks. For this reason, it is important to pay attention to early money flows in the Mag 7 stocks on a daily basis.
In the early trade, money flows are positive in Amazon (NASDAQ:AMZN), Alphabet Inc Class C (NASDAQ:GOOG), Meta Platforms Inc (NASDAQ:META), Microsoft Corp (MSFT), NVIDIA Corp (NVDA), and Tesla Inc (TSLA).
In the early trade, money flows are neutral in Apple Inc (NASDAQ:AAPL).
In the early trade, money flows are positive in S&P 500 ETF (SPY) and Invesco QQQ Trust Series 1 (NASDAQ:QQQ).
Momo Crowd And Smart Money In Stocks
Investors can gain an edge by knowing money flows in SPY and QQQ. Investors can get a bigger edge by knowing when smart money is buying stocks, gold, and oil. The most popular ETF for gold is SPDR Gold Trust (GLD). The most popular ETF for silver is iShares Silver Trust (SLV). The most popular ETF for oil is United States Oil ETF (NYSE:USO).
Bitcoin
Bitcoin (CRYPTO: BTC) is range bound.
What To Do Now
Consider continuing to hold good, very long term, existing positions and add tactical positions based on signals.
The Arora Report is known for its accurate calls. Most recently, we correctly called the rally from recent stock market lows and the 2026 semiconductor decline before a 25% drop in the Semiconductor ETF (SMH). In gold, we bought at an average price near $1,105, close to cycle lows, and took partial profits near $5,400, close to cycle highs. Please click here to get our free forever Generate Wealth Newsletter.
Benzinga Disclaimer: This article is from an unpaid external contributor. It does not represent Benzinga’s reporting and has not been edited for content or accuracy.
Login to comment